![]()
Arm-based computers are continuing to make inroads across both personal computing as well as cloud server spaces. From the Arm-based MacBooks you can use during your development stages, to the Graviton2-based instances on AWS, which we recently showed provide better price-performance than similar Intel x86-based instances.
Yet Amazon is not the only cloud provider providing Arm-based instances. Oracle Cloud offers the Ampere Altra A1, which scales to 80 cores per CPU.
![]()
The Ampere Altra chip has up to 80 cores and runs at speeds up to 3.3 GHz.
Offering an Arm-based server is half the battle. Then developers need to make sure their apps run on it without a hitch. So when I ported Scylla to run on the Arm-based Ampere A1 server, I discovered a curious problem. While in due time we’ll share full performance benchmarking results of running on such a big beefy server, I first wanted to share the results of my troubleshooting with the community to serve as an example of the kinds of issues a developer might encounter when releasing code for an Arm-based platform.
Also, to be clear, and a bit of a spoiler up-front, the issue encountered was not due to the Arm-based Ampere Altra platform itself. So what was the problem?
The Problem
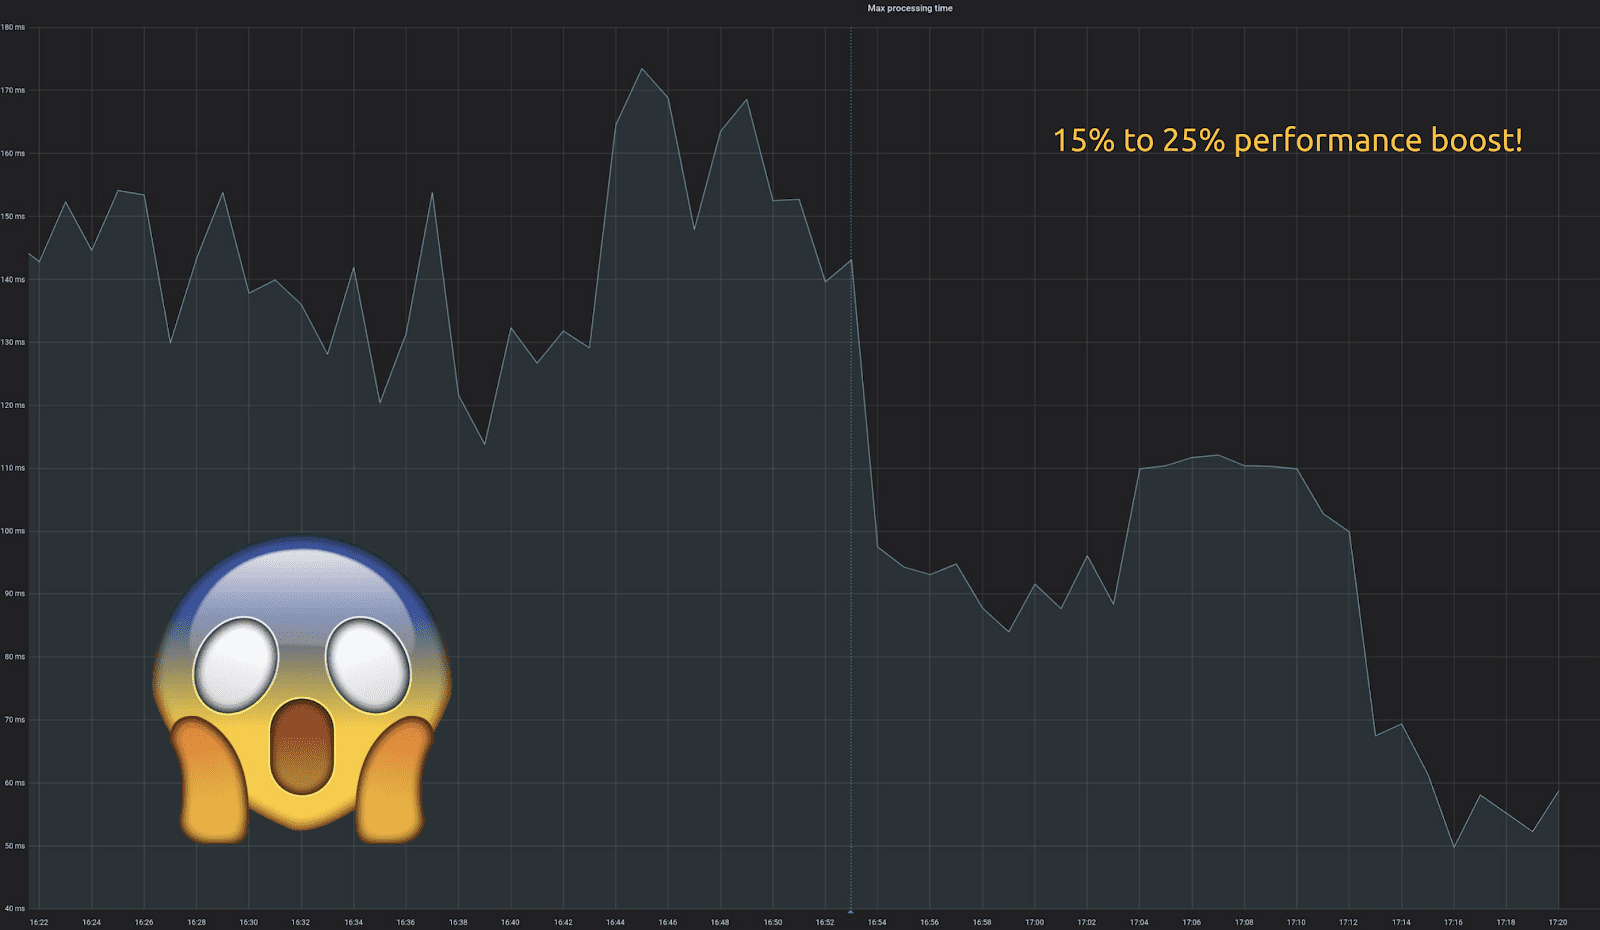
When testing Scylla’s performance on Oracle Cloud’s new ARM machines (the bare metal Ampere A1 with 80 ARM cores) I noticed that some runs were significantly slower than expected.
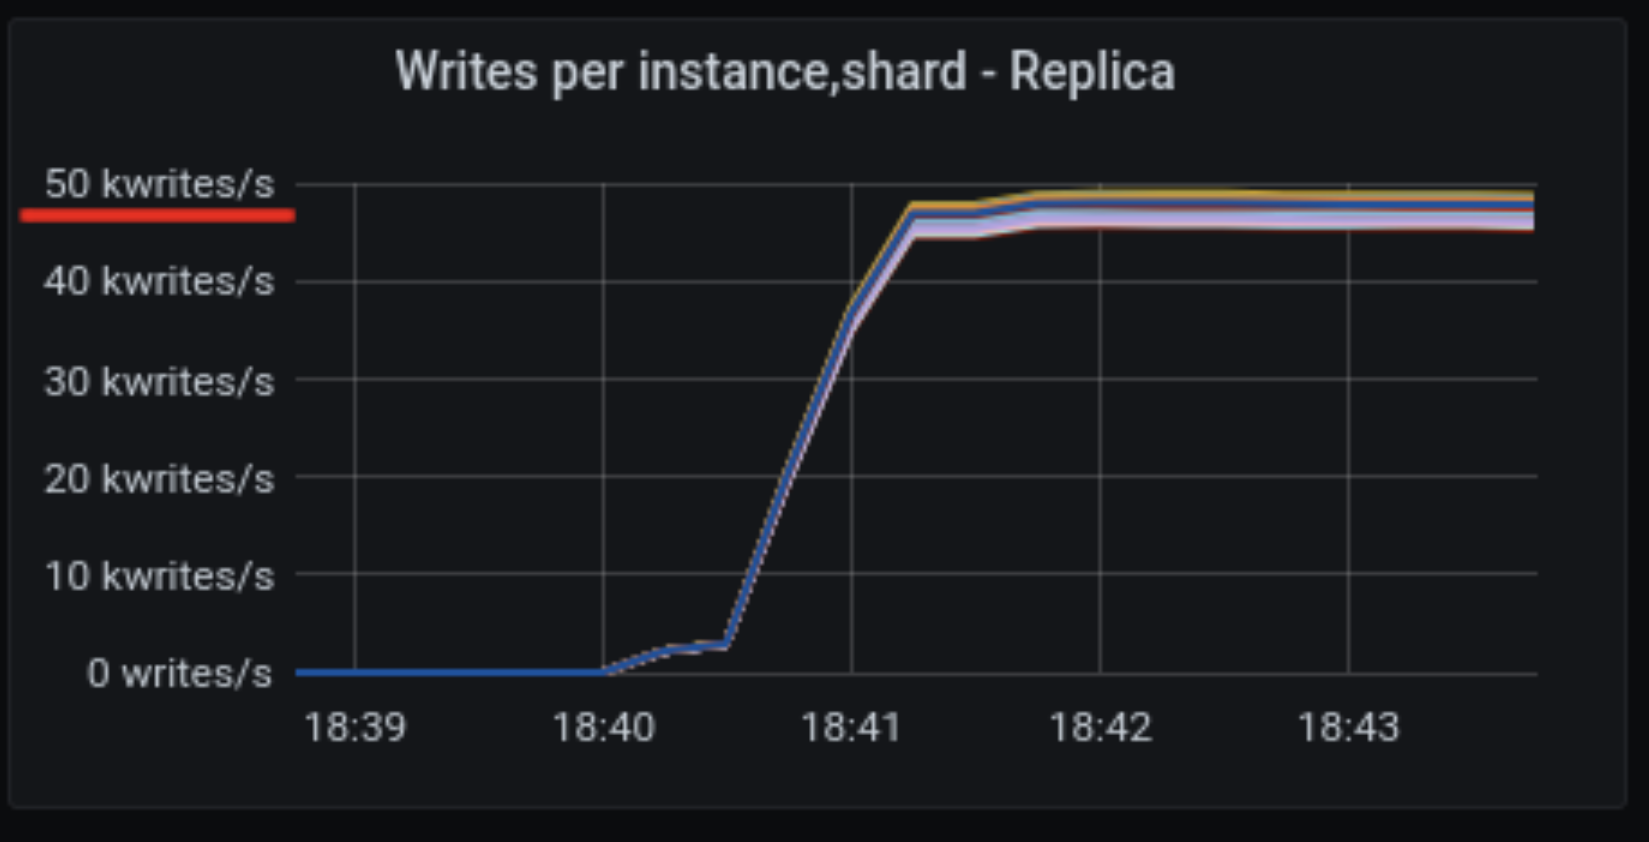
I repeated the benchmark many times, and determined that its behavior was bimodal: either Scylla was running at full, expected throughput (around 45k writes per core per second), or at 40% throughput – never in between. The slow runs were happening about as often as the fast runs, but fast and slow runs were interleaved randomly, without any visible pattern.
![]()
On a good run, shards were able to sustain ~50,000 writes operations per second per shard.
![]()
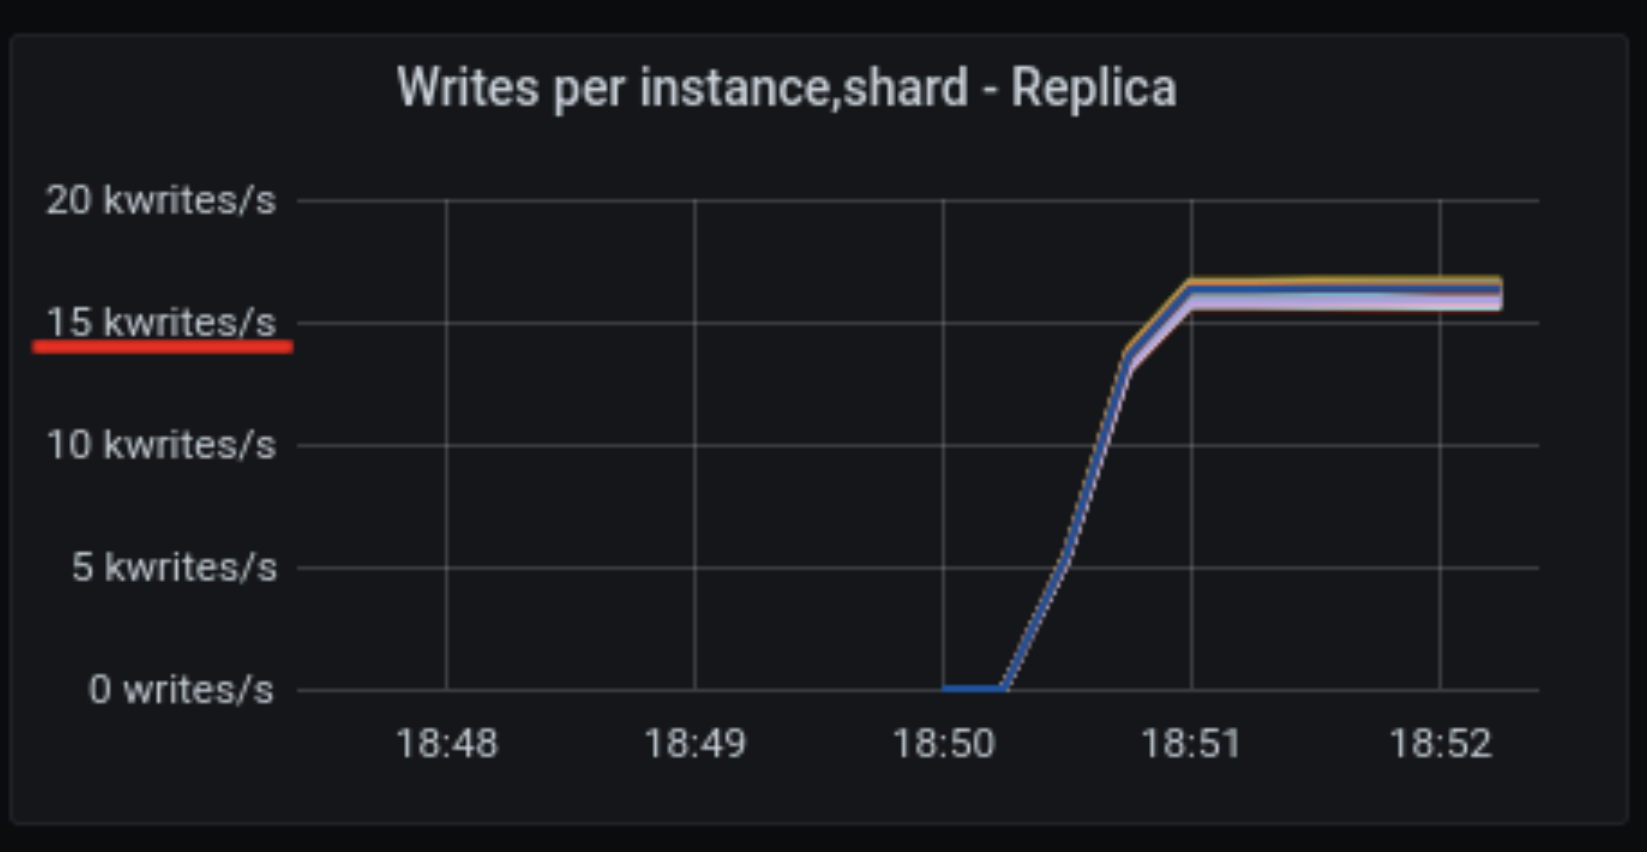
On the same server, on a different run of the same benchmark, shards were only attaining ~16,000 write operations per second per shard; or less than 40% of the performance of the good run.
Without reading further, do you already have a hunch as to the answer? Make a mental note, and then let’s see what we discovered.
Hardware Utilization
When looking for any bottleneck, we should start by checking resource utilization. 100%-utilized resources are bottleneck candidates. If no resource is utilized at 100%, we are witnessing either a client-side problem, or a scheduling problem (i.e. a thread is sleeping even though resources are available). In Scylla’s case, the main constraining resources we look at are CPU, RAM, network and disk.
The benchmark which exposed the problem was specifically meant to stress the CPU:
cassandra-stress write duration=1h cl=QUORUM -pop dist=UNIFORM\(1..100000\) -mode native cql3 maxPending=1024 -rate threads=1000 -node 10.0.0.107
With the dataset this small, all writes should be happening in RAM, and not be flushed to disk. We have also disabled the commitlog for this test, so the disk should be silent.
Looking at cassandra-stress’s default schema, we expect network traffic of about 200 bytes per query, which (given 50k ops/core/second) adds up to about 10MiB/core/s. For this benchmark I happened to be running Scylla on 32 cores (I didn’t have enough client nodes available in this network to utilize all 160 cores), so that’s a total of 320MiB/s, or about 2.6Gib/s. This is nowhere near the advertised throughput of 100Gib/s, so we don’t expect the network to be the problem.
Let’s check the metrics:
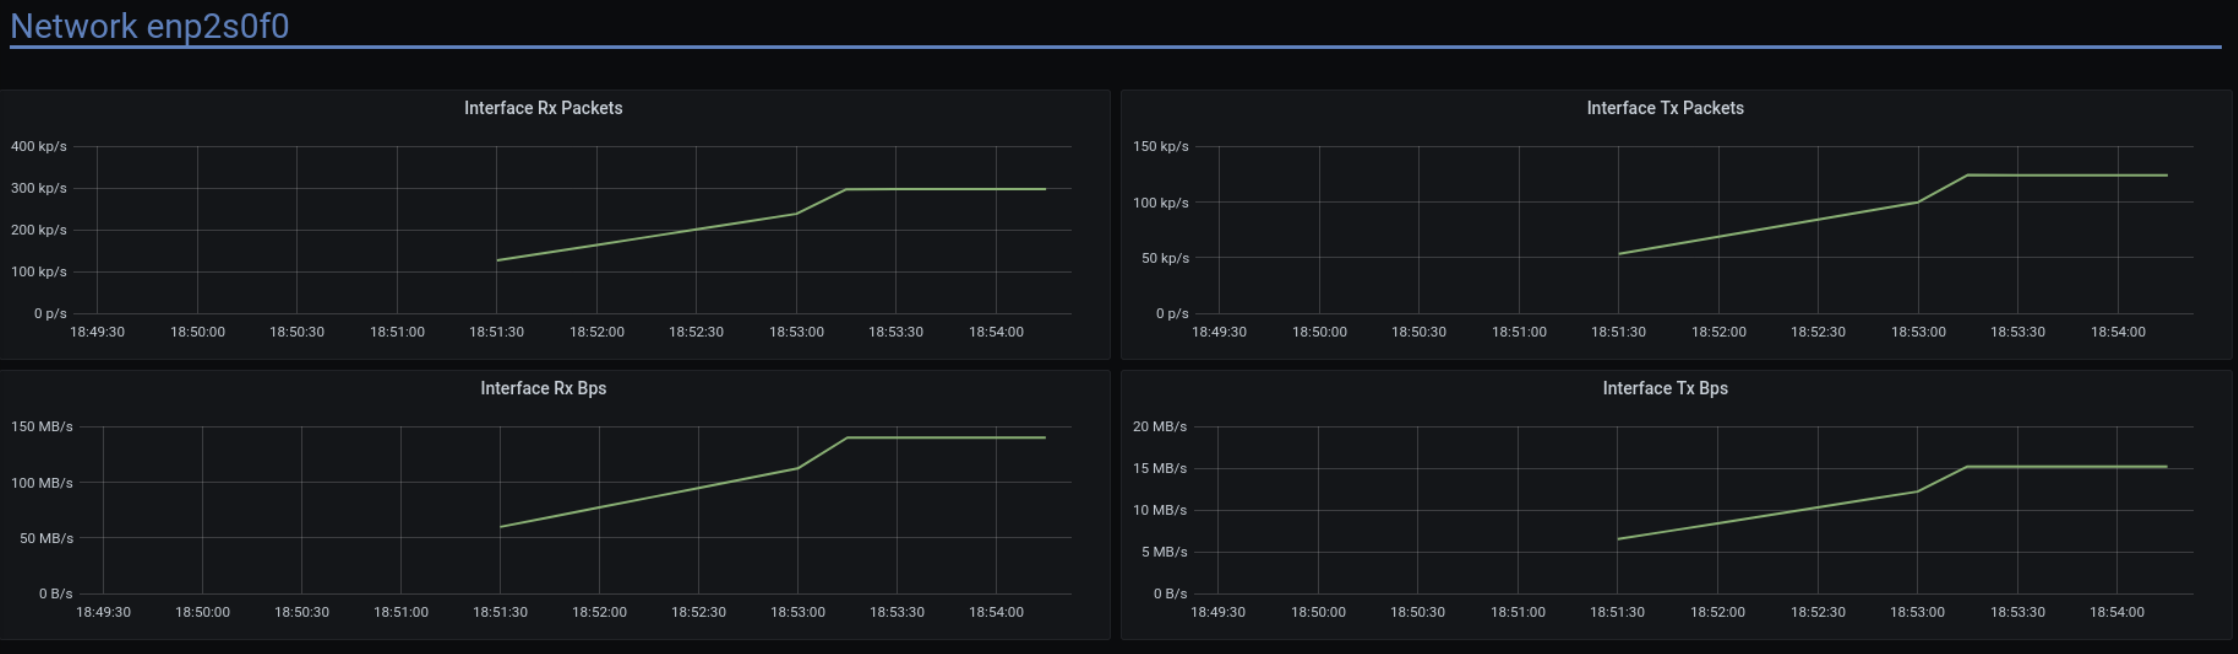
![]() Network performance
Network performance
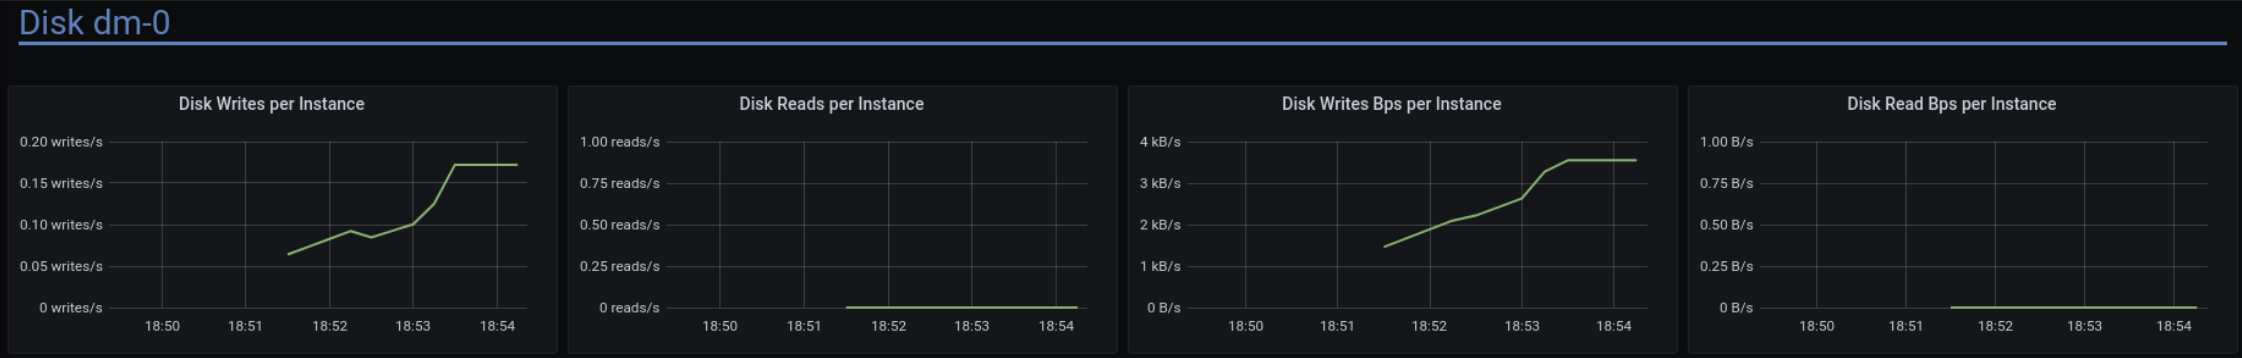
![]() Disk performance
Disk performance
![]() CPU load
CPU load
As expected, the disk is almost silent, the network traffic is within expectations and way below its maximum capacity, and CPU load is 100%. (Not for all shards – but this is expected. We asked cassandra-stress for uniform load distribution, so slightly faster shards are slightly less utilized. The slowest shard is the bottleneck.)
This clearly seems like a CPU bottleneck. But if we want to double-check that the network is fine, we can just run the benchmark clients on the same machine – I did that and the throughput stayed exactly the same. So let’s move on to diagnosing the CPU.
Basic CPU Stats
There are two possibilities: either a) the slow runs are doing more work per query or b) the CPU is doing the work more slowly. To find out which one is happening, we should start by looking at IPC (instructions-per-cycle). A decreased IPC will mean that the CPU is doing the work more slowly.
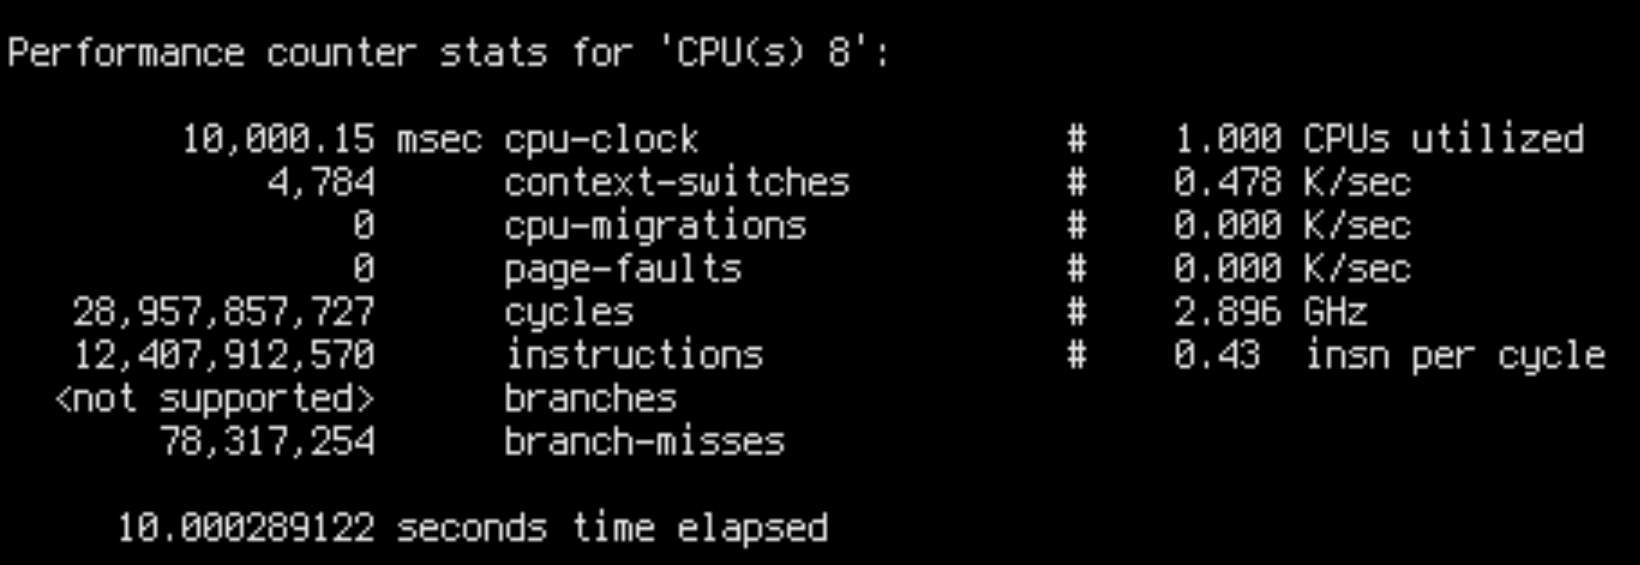
sudo perf stat -C8 --timeout 10000
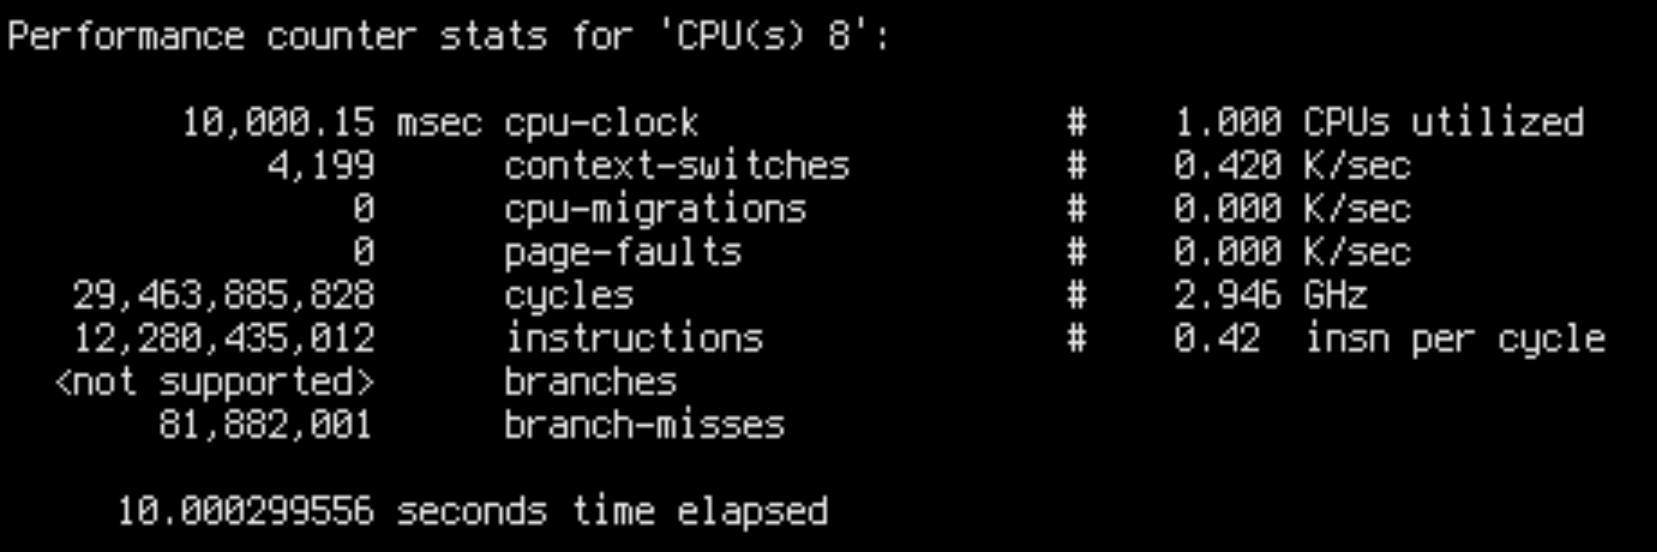
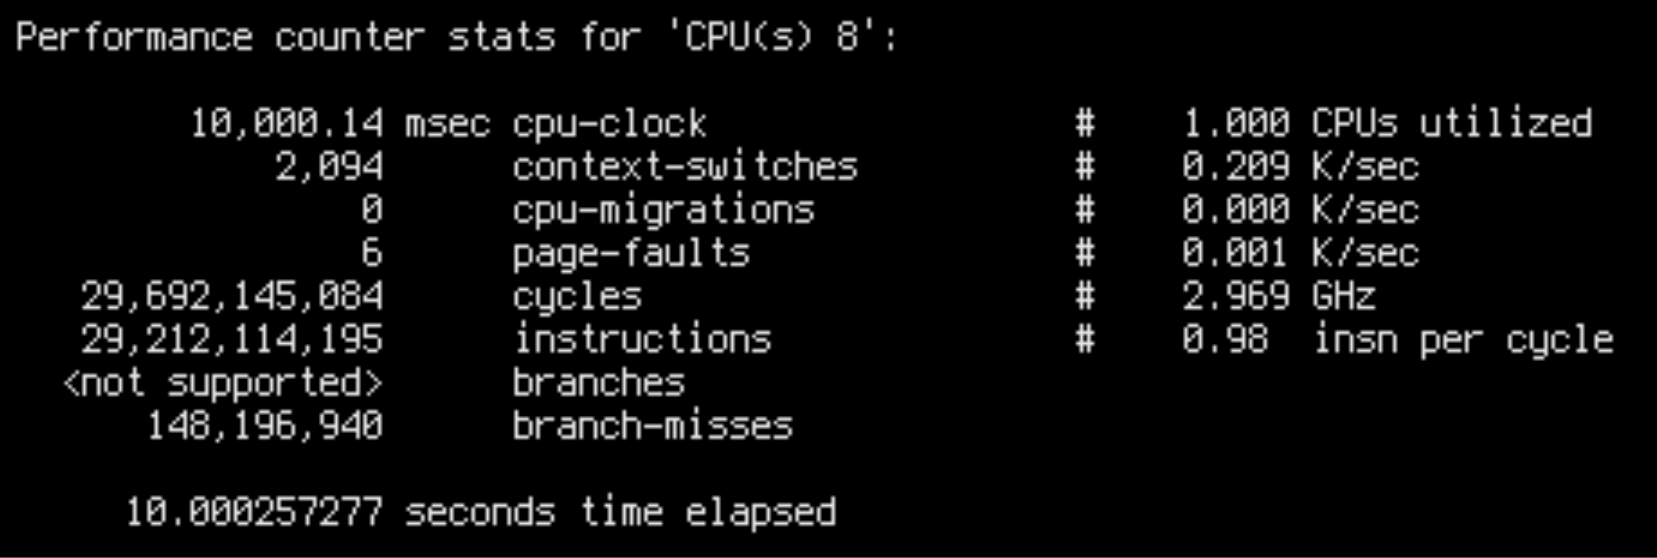
![]()
![]()
IPC is 0.42 for slow runs and 0.98 for fast runs. This is fairly close to the throughput ratio: ~16k/core/s for slow runs and ~45k/core/s for fast runs.
This is damning evidence that we are facing a low-level CPU bottleneck. Slow runs aren’t doing additional work, but are worse at utilizing the CPU.
There are a few possible explanations for bad CPU utilization. Most importantly: unpredictable branches, unnecessary data dependencies and cache misses. Intuitively, in our case only cache misses make sense, because in both cases the CPU is executing the same code on the same data. Besides, we can see in the output of perf stat that the slow case had less branch misses overall.
Flamegraph
Before we do anything more, let’s disable address space layout randomization to make investigation and cross-referencing addresses easier.
echo 0 | sudo tee /proc/sys/kernel/randomize_va_space
Now, before we try to understand the nature of stalls, let’s try to find them. We can use flamegraphs for that.
git clone https://github.com/brendangregg/FlameGraph
git -C FlameGraph remote add adamnovak https://github.com/adamnovak/FlameGraph
git -C FlameGraph fetch adamnovak
git -C FlameGraph cherry-pick 7ff8d4c6b1f7c4165254ad8ae262f82668c0c13b # C++ template display fix

x=remote
sudo timeout 10 perf record --call-graph=fp -C8 -o $x.data
sudo perf script -i $x.data > $x.perf
FlameGraph/stackcollapse-perf.pl $x.perf > $x.folded
FlameGraph/flamegraph.pl $x.folded > $x.svg
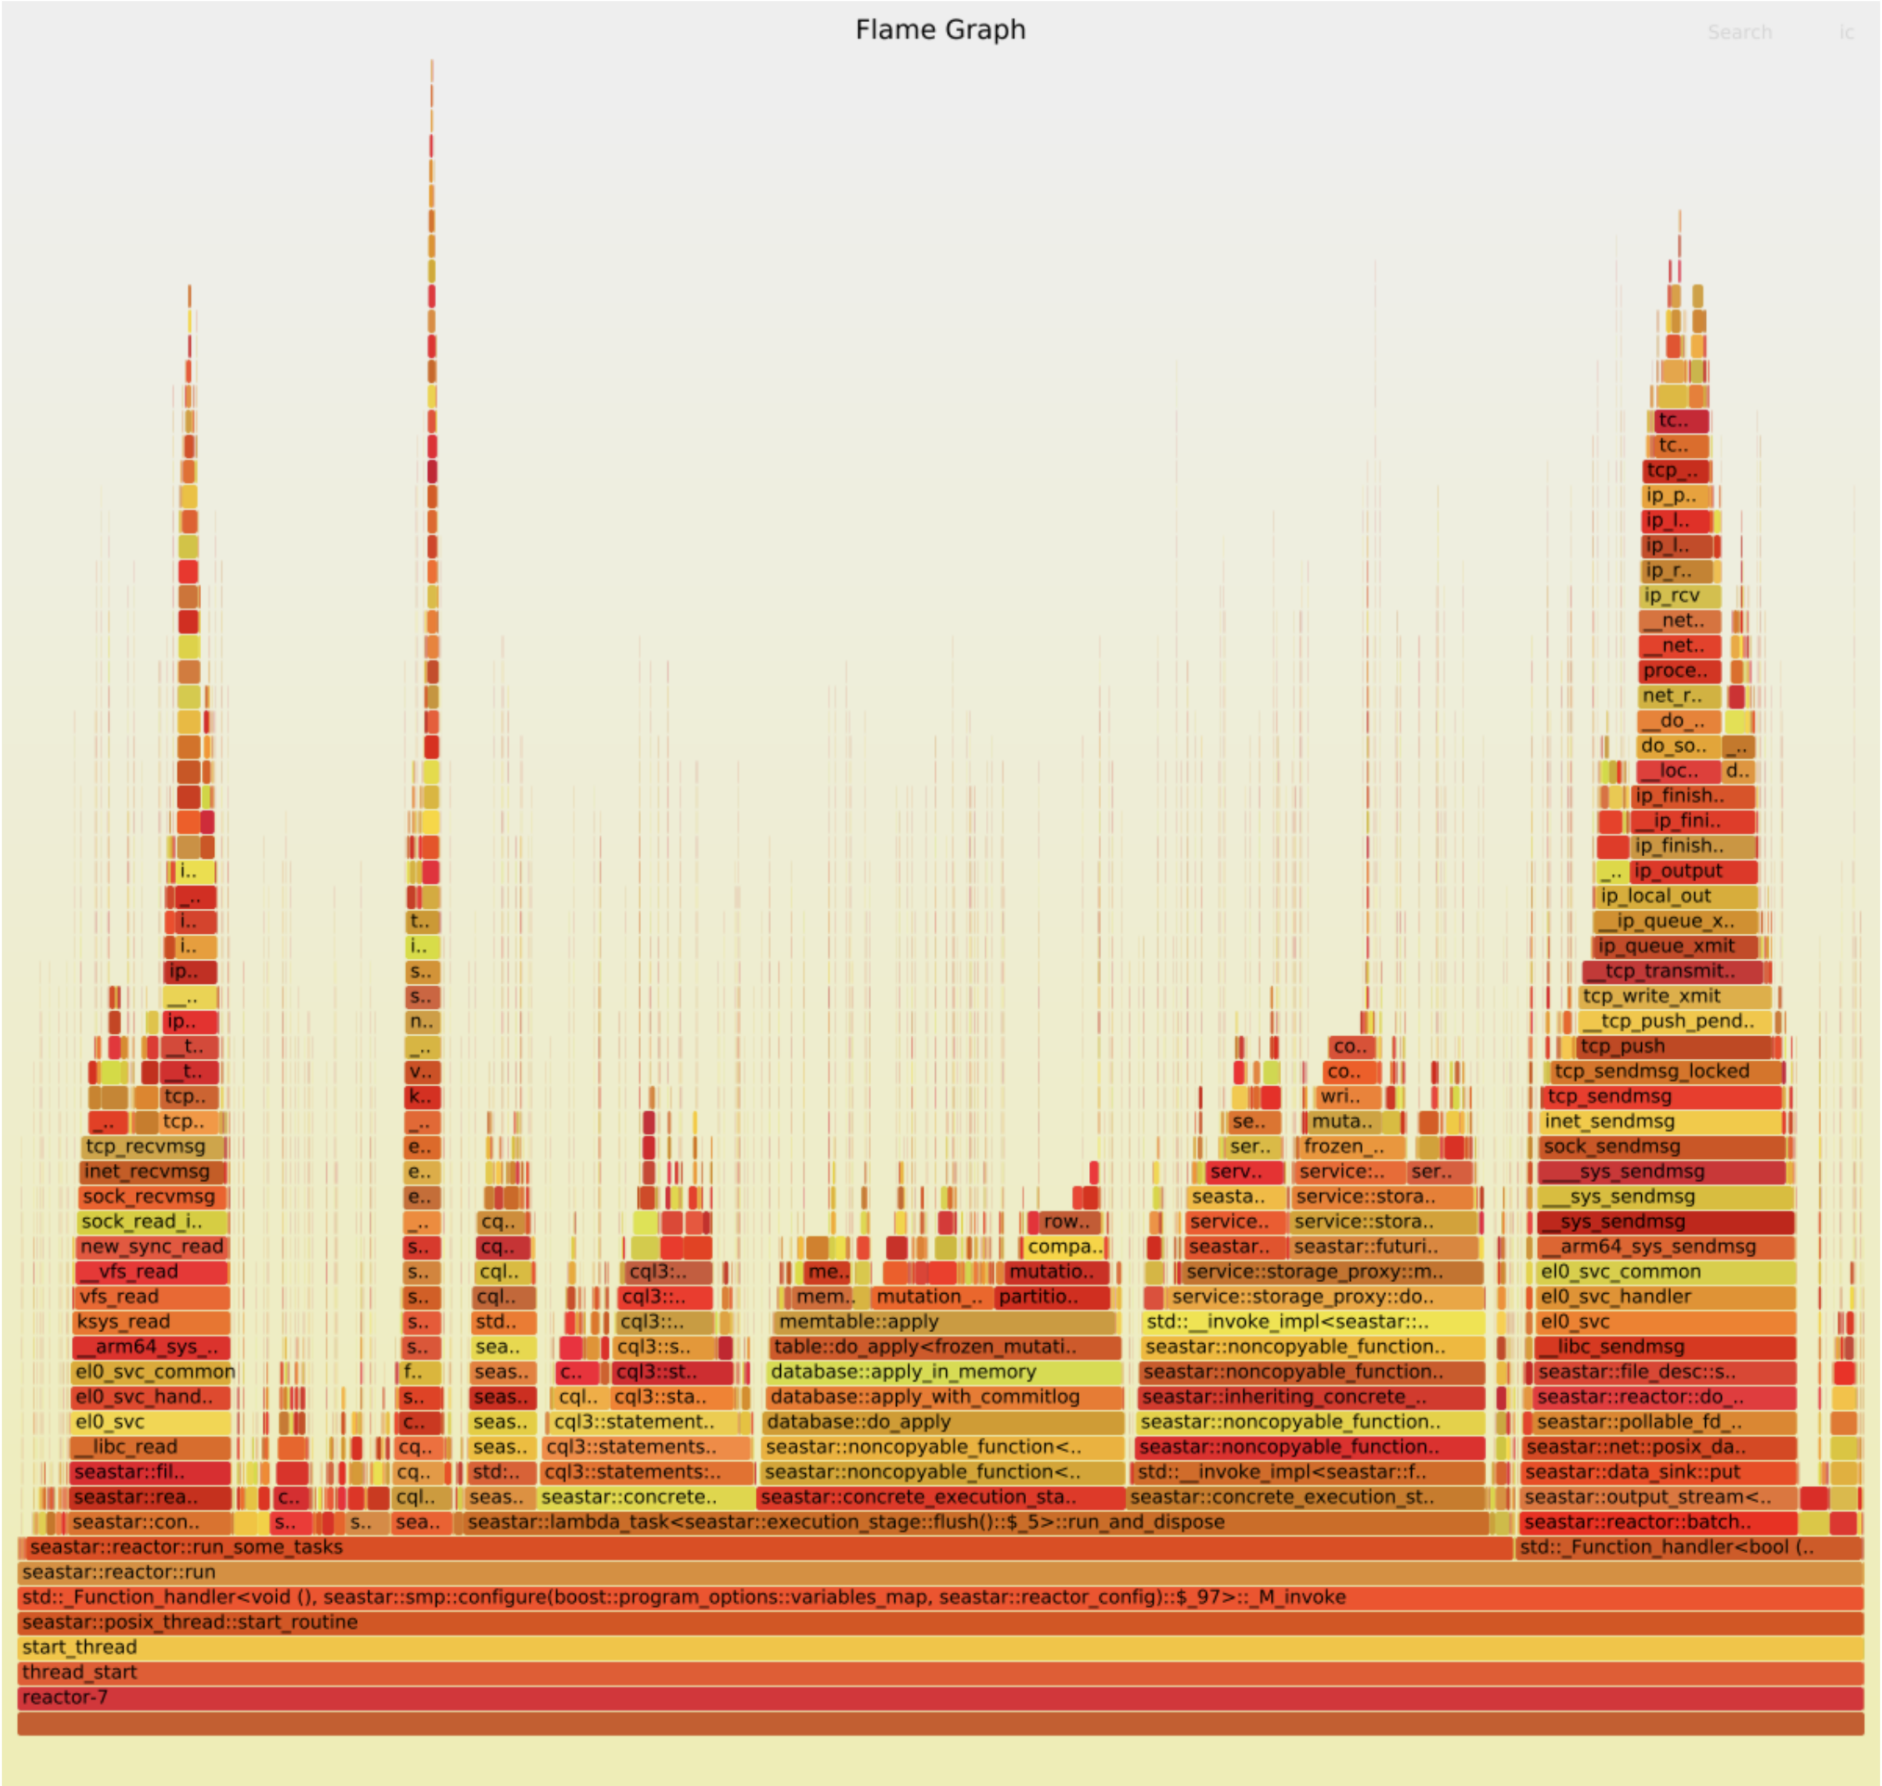
![]() The”good case”
The”good case”
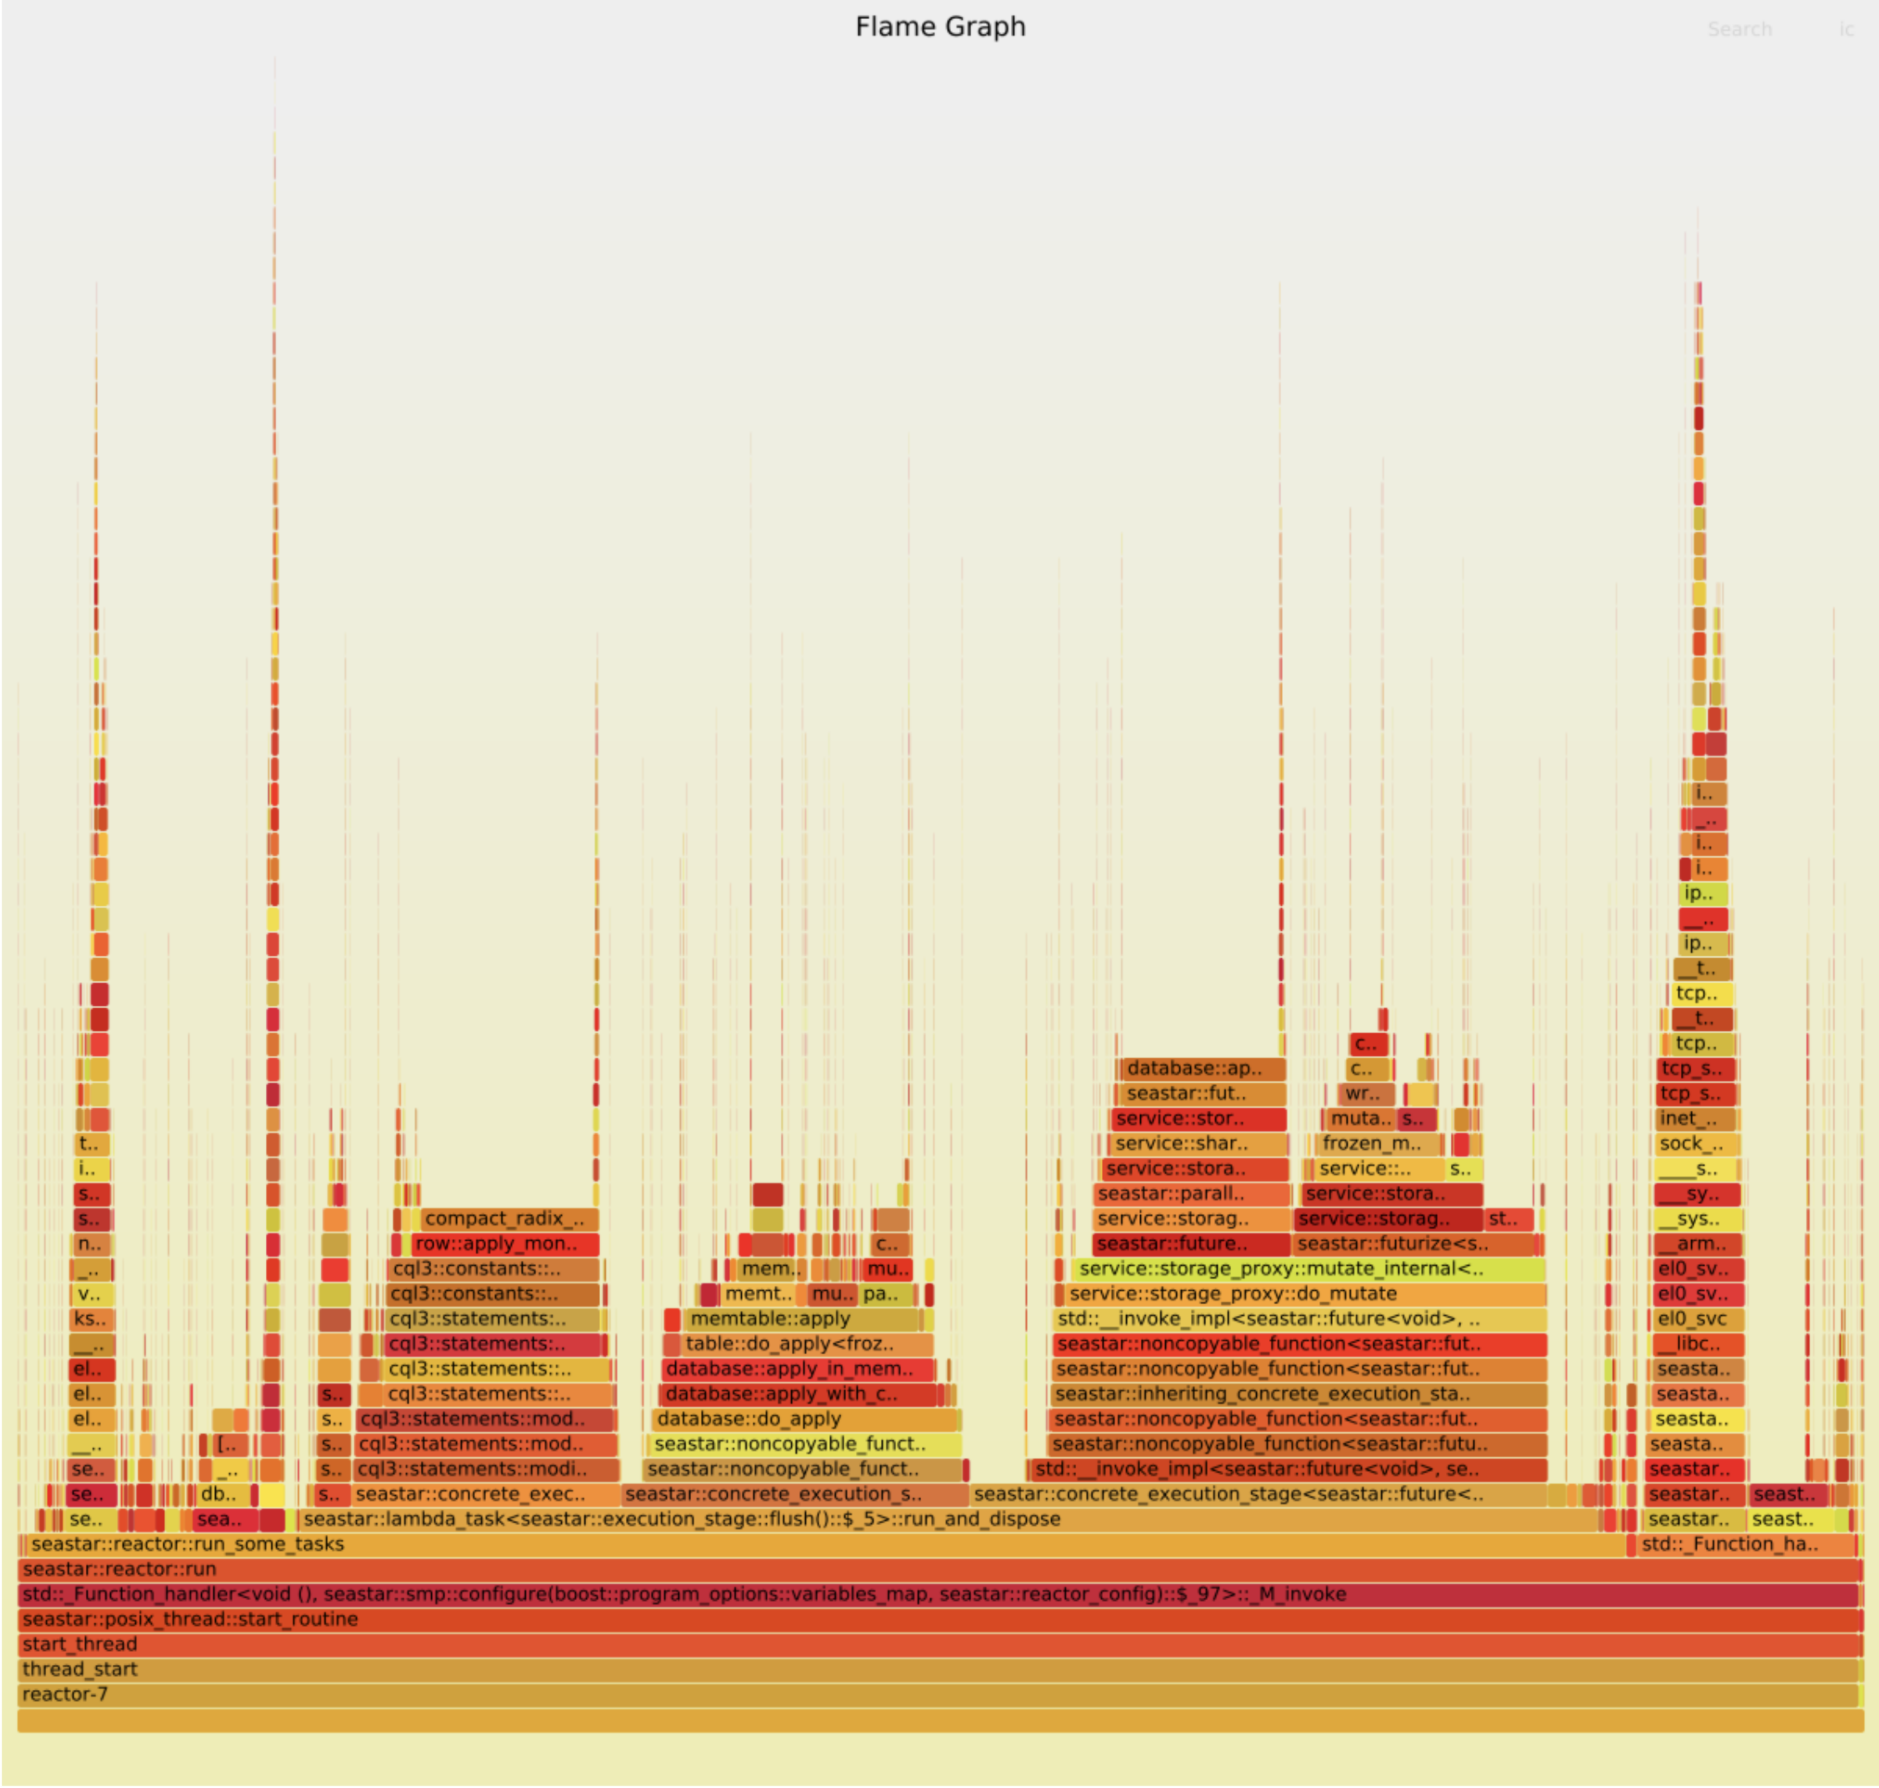
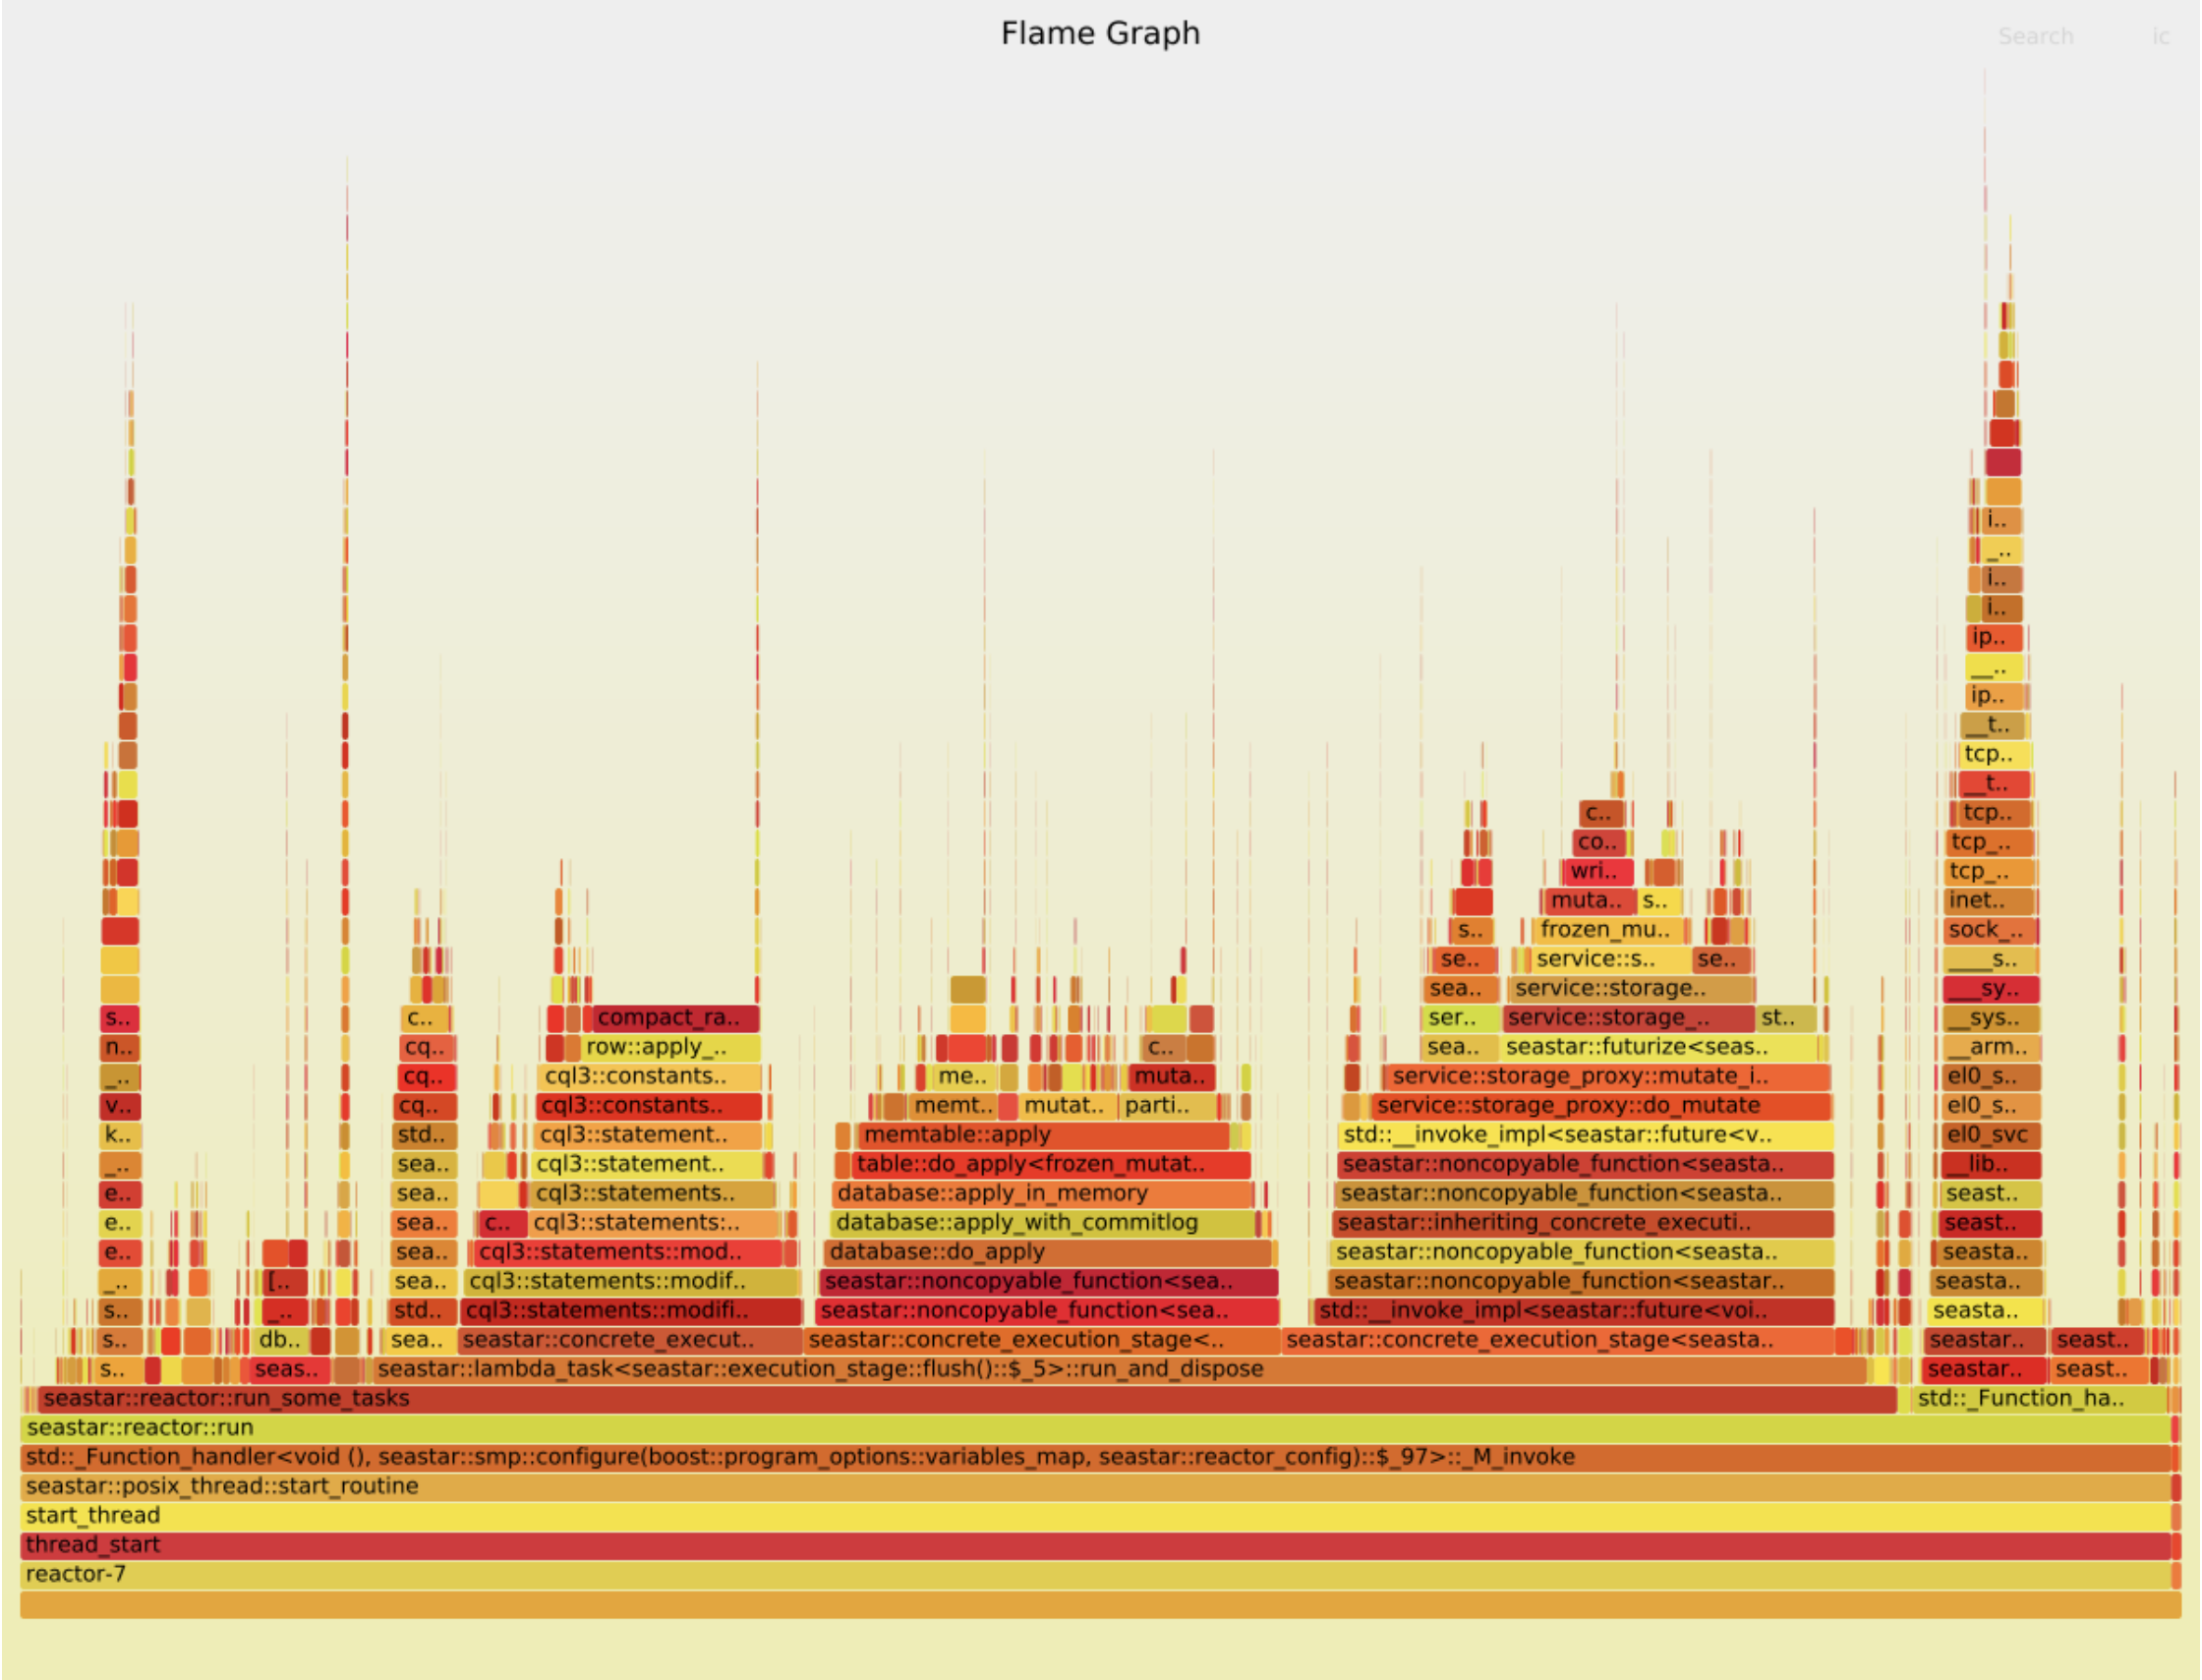
![]() The “bad case”
The “bad case”
Two things stand out:
- TCP handling takes proportionally more time in the good case. This is probably because the rest of the code is faster. (Let’s ignore this part of the graph for now.)
- There are two wide peaks in the bad case, which aren’t visible at all in the good case:
compact_radix_tree::tree::get_at() and database::apply(). Each takes about 10% of the total work. We should investigate them.
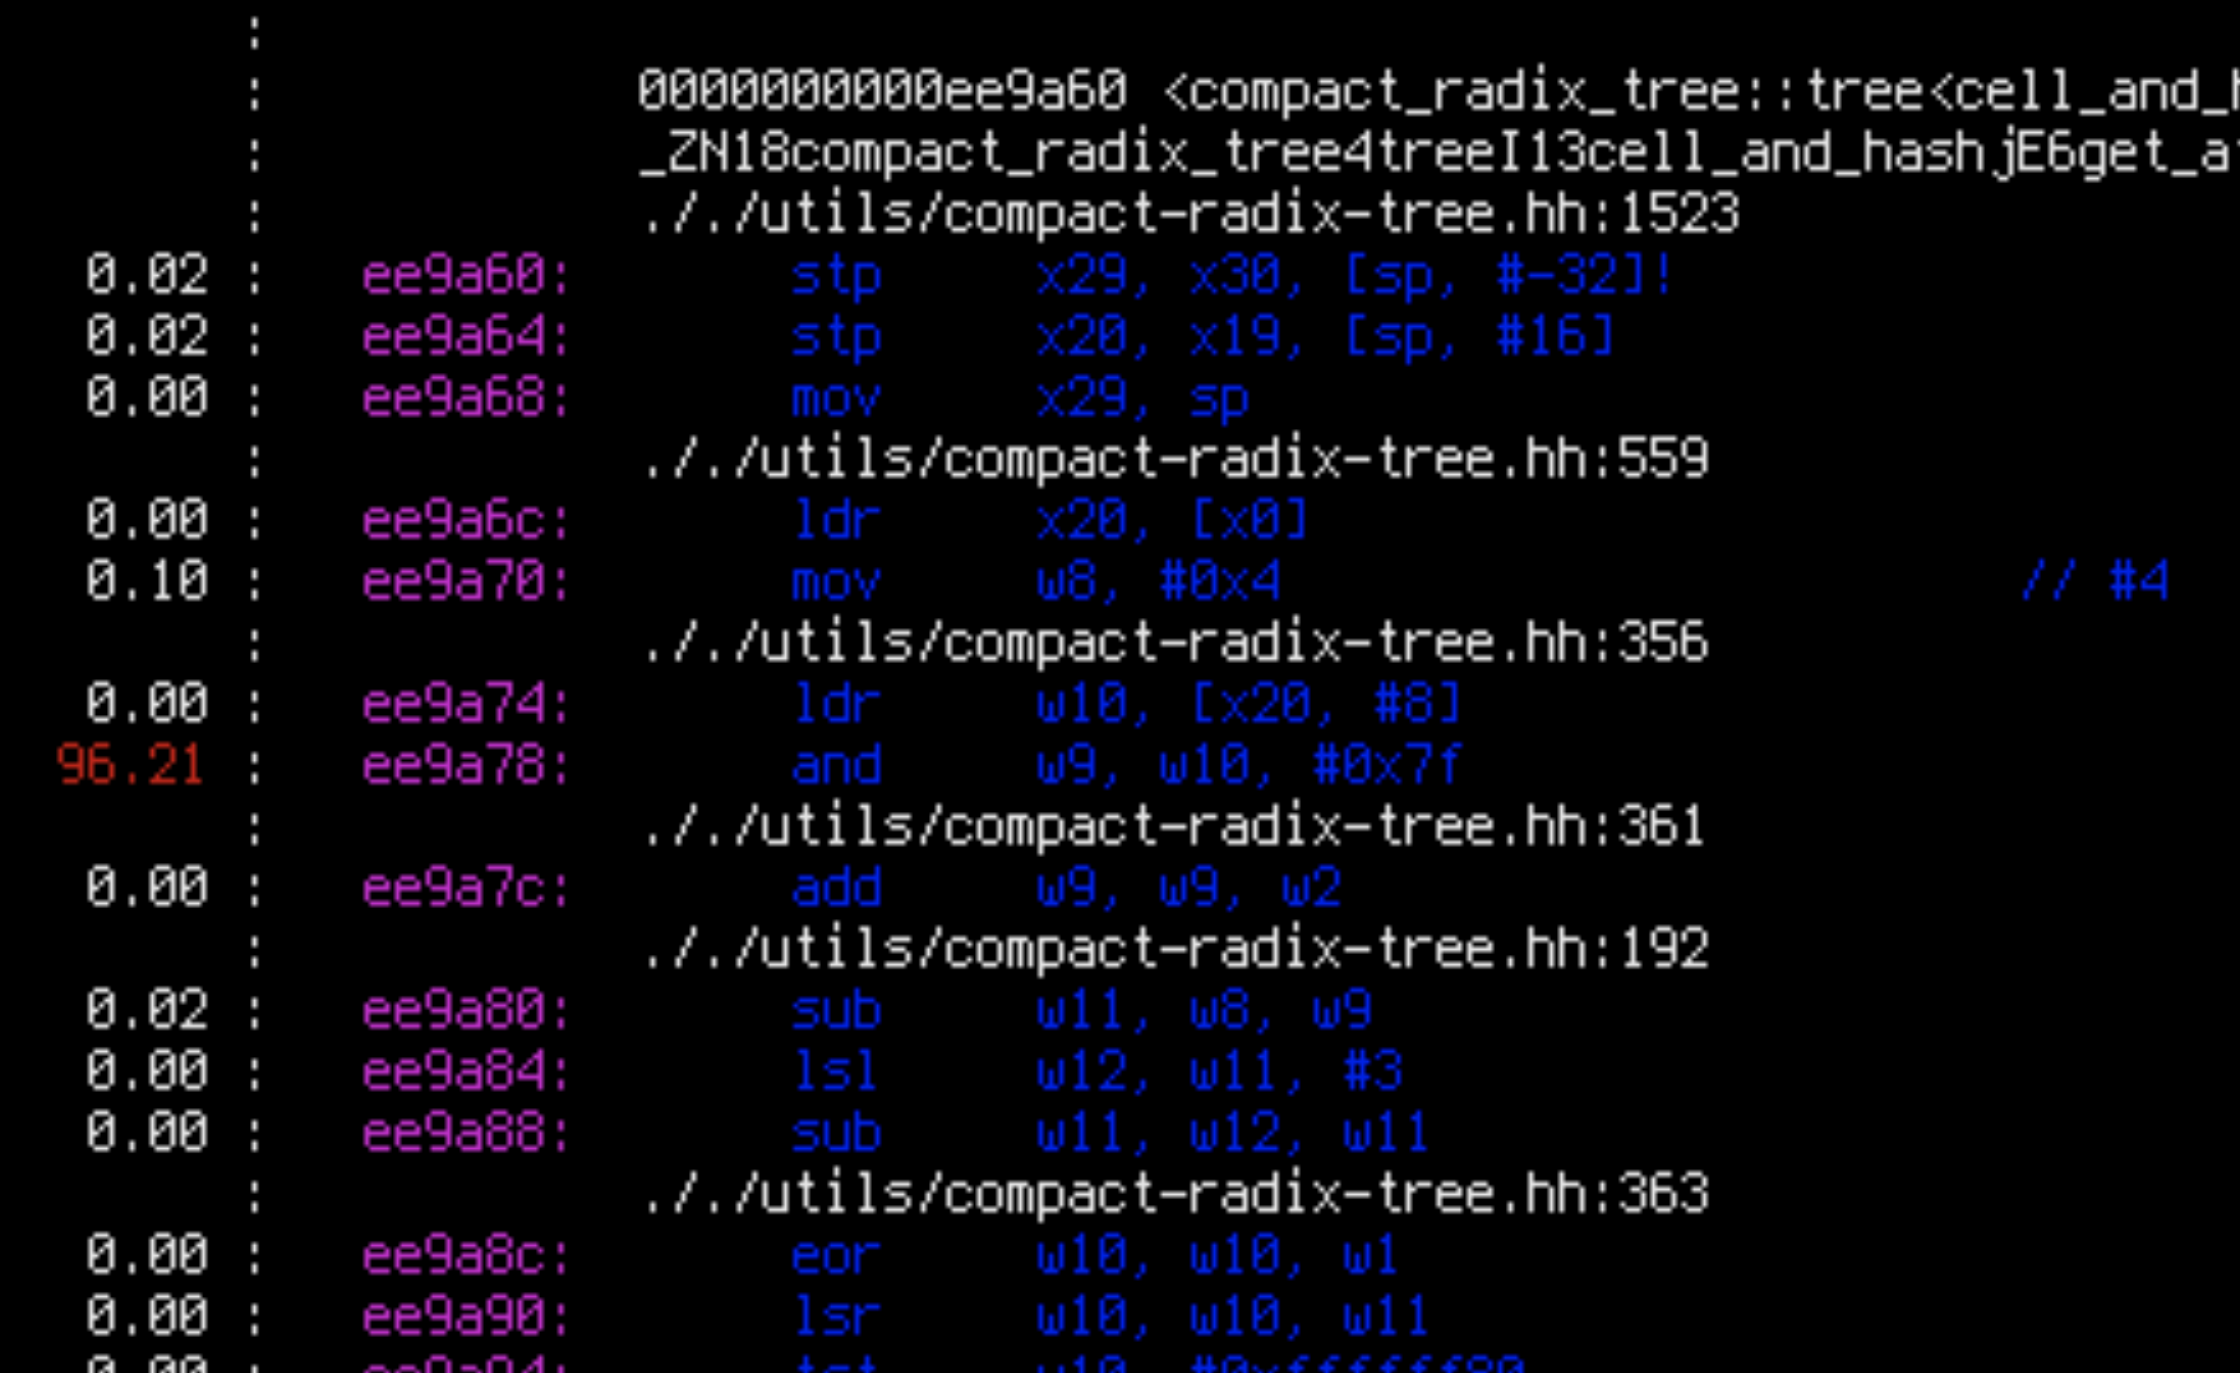
Let’s look at an instruction-level breakdown of those samples:
sudo perf annotate -i $x.data
![]()
![]()
Apparently, for each of the two suspicious functions, 99% of the time is spent in a single load instruction.
Cross-referencing the assembly and the source code, we see that for compact_radix_tree::tree::get_at() that ee9a74: ldr w10, [x20, #8] is the first instruction which loads something from a tree node to memory when the tree is being searched. That seems like a very reasonable bottleneck: walking a tree is exactly where we would expect cache misses to occur.
However, in database::apply, cbbfa8: ldr w9, [x26, #3720] is the instruction which loads the current log level from memory. (It is then compared with log_level::trace in cbbfc4: cmp w9, #0x4). This is not reasonable: the log level should be perfectly cached. Besides, it is only used in a predictable comparison: the CPU should be able to continue executing the program speculatively while it’s waiting for the result of the load. Very weird. Let’s patch this instruction away and see what happens.
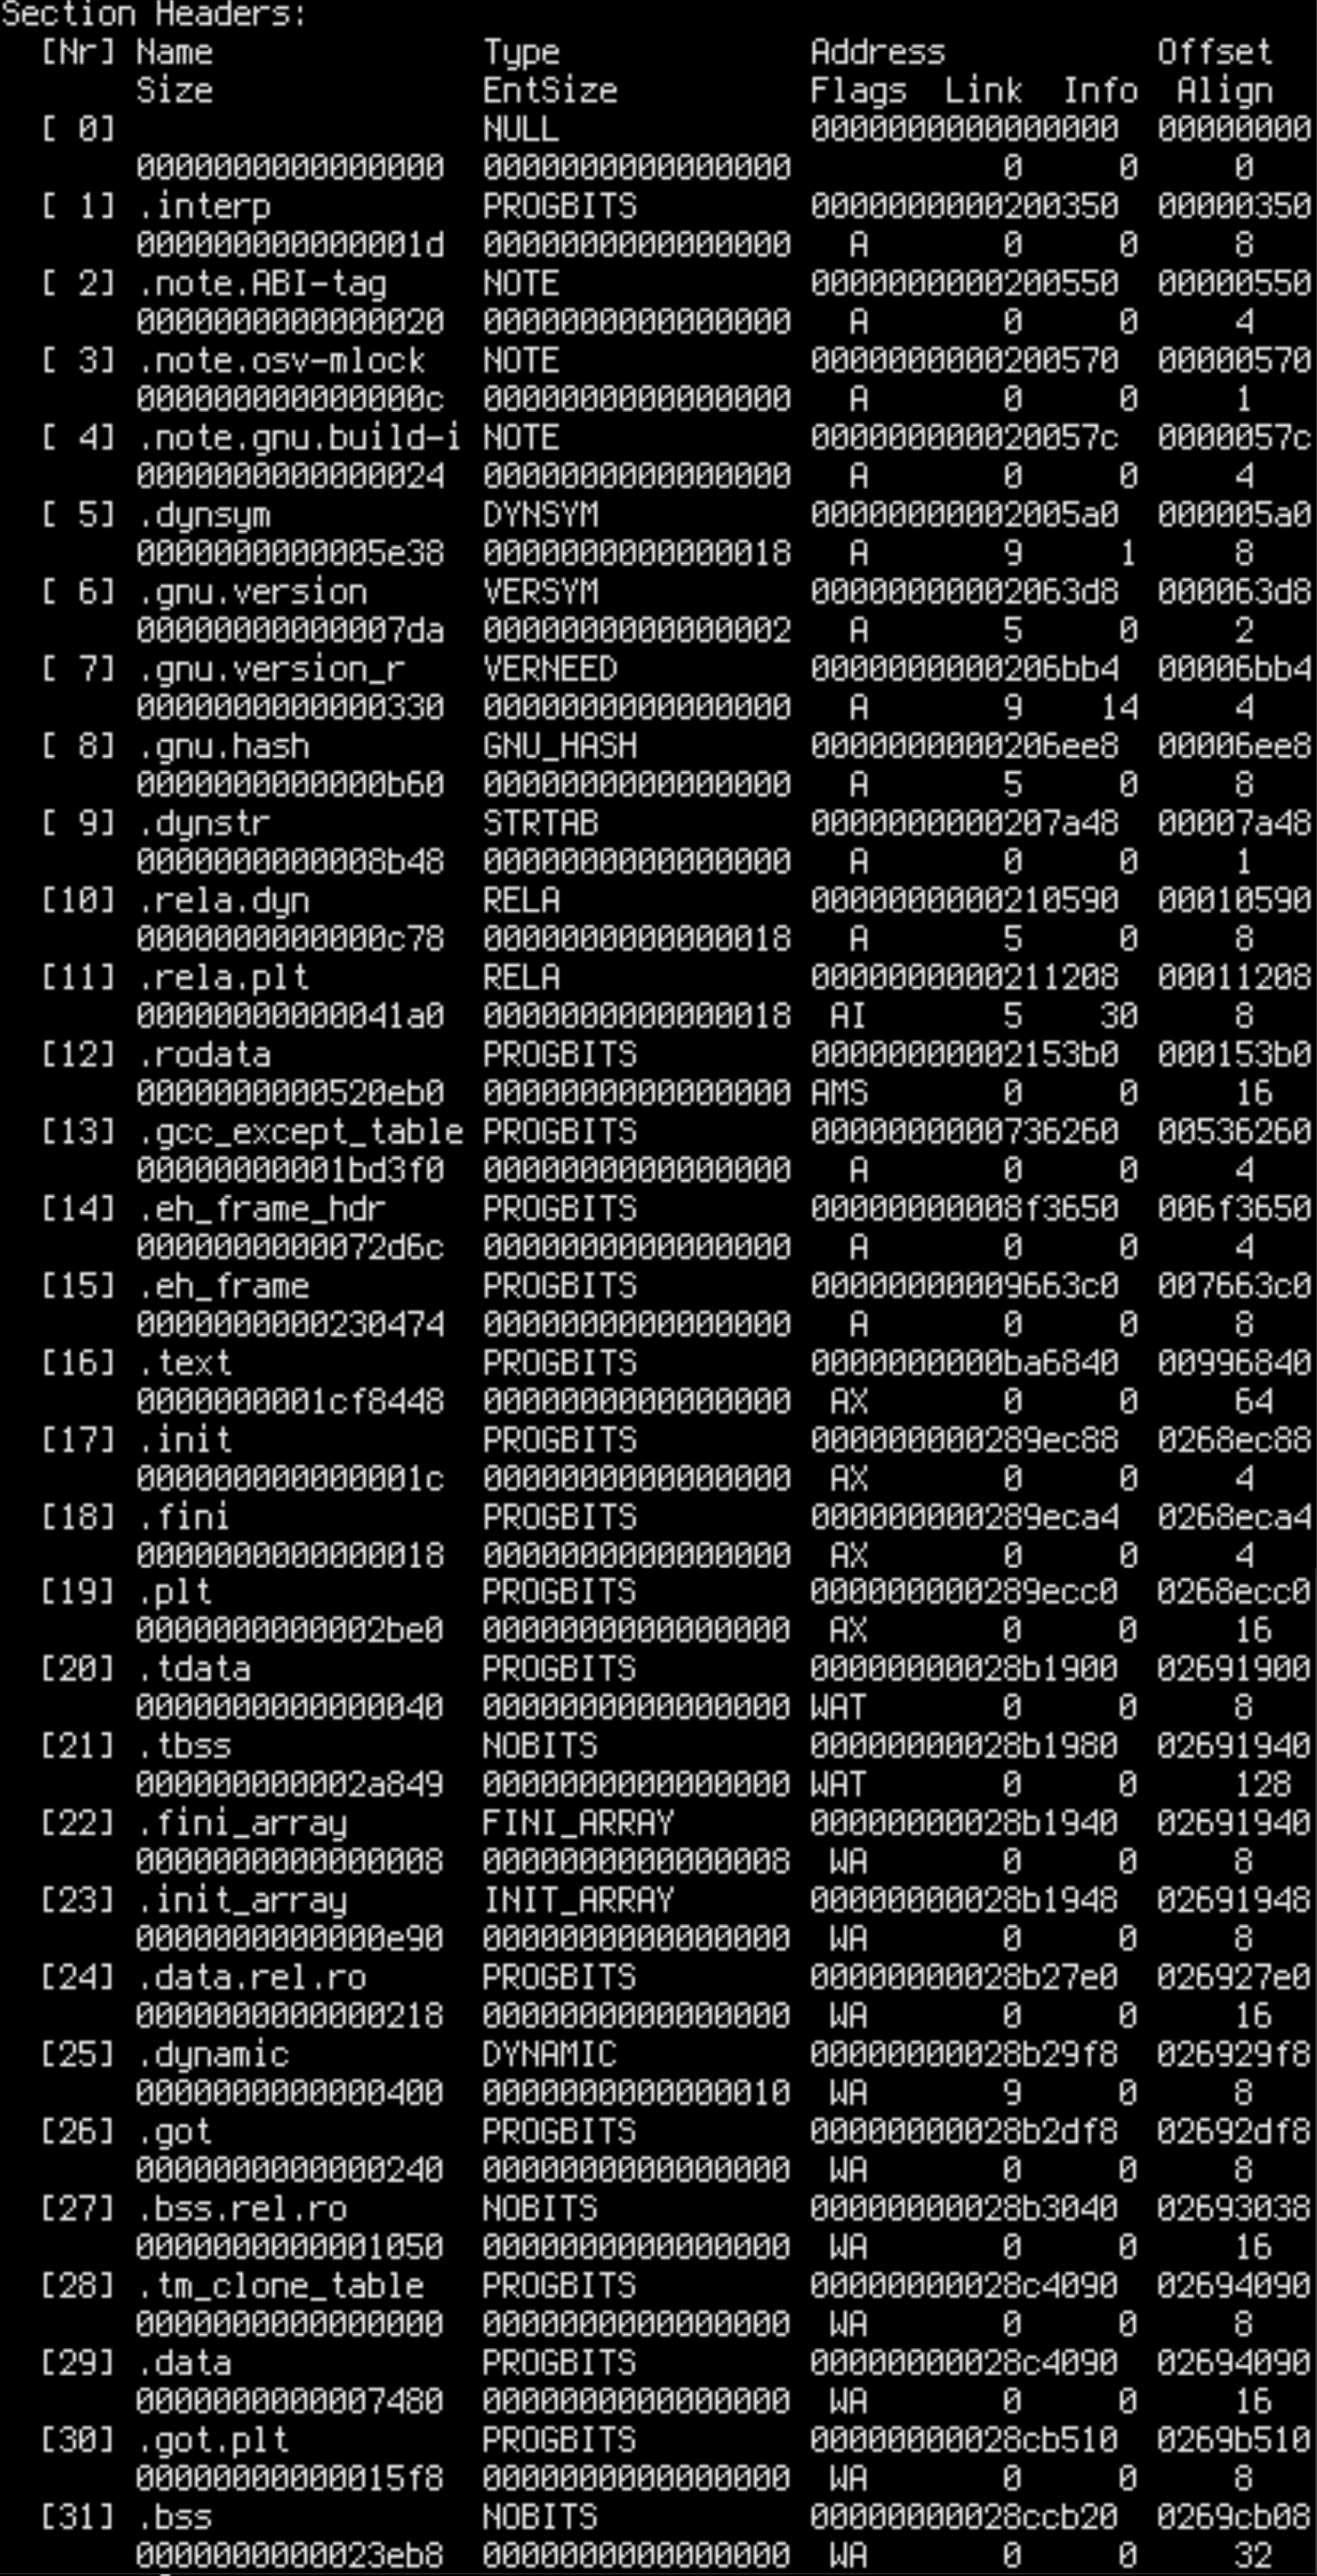
readelf --headers /opt/scylladb/libexec/scylla | grep -A1 -m1 .text
![]()
echo 'mov w9, #0' | as -o patch.o
objcopy -O binary patch.o patch.bin
sudo dd of=/opt/scylladb/libexec/scylla seek=$((0xcbbfa8 - 0xba6840 + 0x996840)) if=patch.bin bs=1 conv=notrunc
Instead of loading the log level from memory, we have hardcoded #0 (log_level::error). Let’s try to get another bad run and see what’s different.
![]()
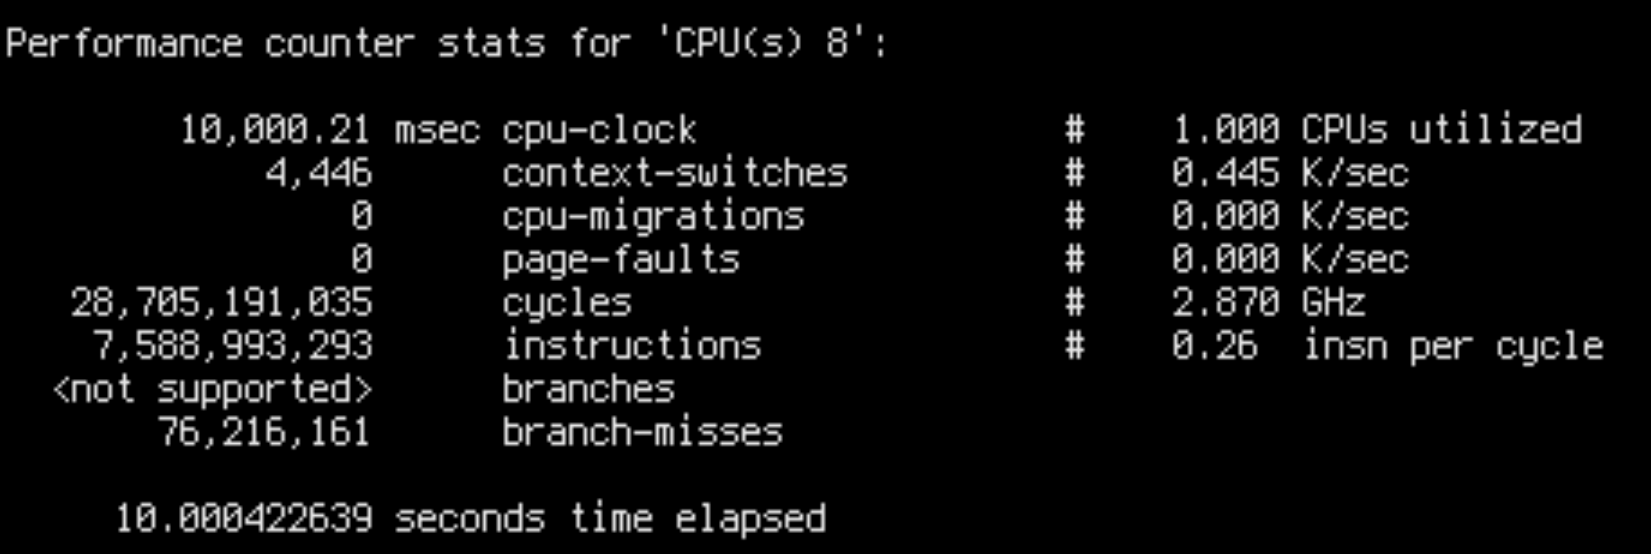
database::apply has disappeared from the graph. Yet…
![]()
There seems to be a very slight improvement: IPC has improved from 0.42 to 0.43, and throughput from 470k ops/s to 480k ops/s. But that’s nowhere near the 10% that we supposedly removed. The “bottleneck” has just dispersed, not disappeared.
This doesn’t make sense. What’s going on?
PMU
Unfortunately it seems that cycle flamegraphs won’t help us. Let’s take a step back.
We have already mentioned that cache misses are the only reasonable cause. But there are two possibilities: either a) there are more of them, or b) the penalty is greater. A greater amount of cache misses could be caused by very unlucky aliasing. Let’s check if that’s the case.
CPU’s performance monitoring unit (PMU) gives access to cache miss statistics. We can find their names in perf list and read them e.g. with perf stat --timeout 10000 -e l2d_cache_refill. But if we search only for events that seem relevant, we might miss something. Let’s just dump all of them.
We write a script which extracts a list of all available PMU events on this architecture from ARM’s documentation. We can print their number and pass them to perf stat. We collect all events with
sudo perf stat --timeout 1000000 -C8 ...events... -x\t 2>&1 | sed 's/<not counted>/0/g'
PMUs have a limited number of hardware counters, so perf can’t count all events at once – it has to multiplex them. This means that results will be approximate. This should not be a problem for us, since we are repeating a single workload, but let’s use a long timeout to minimize the variance, just in case.
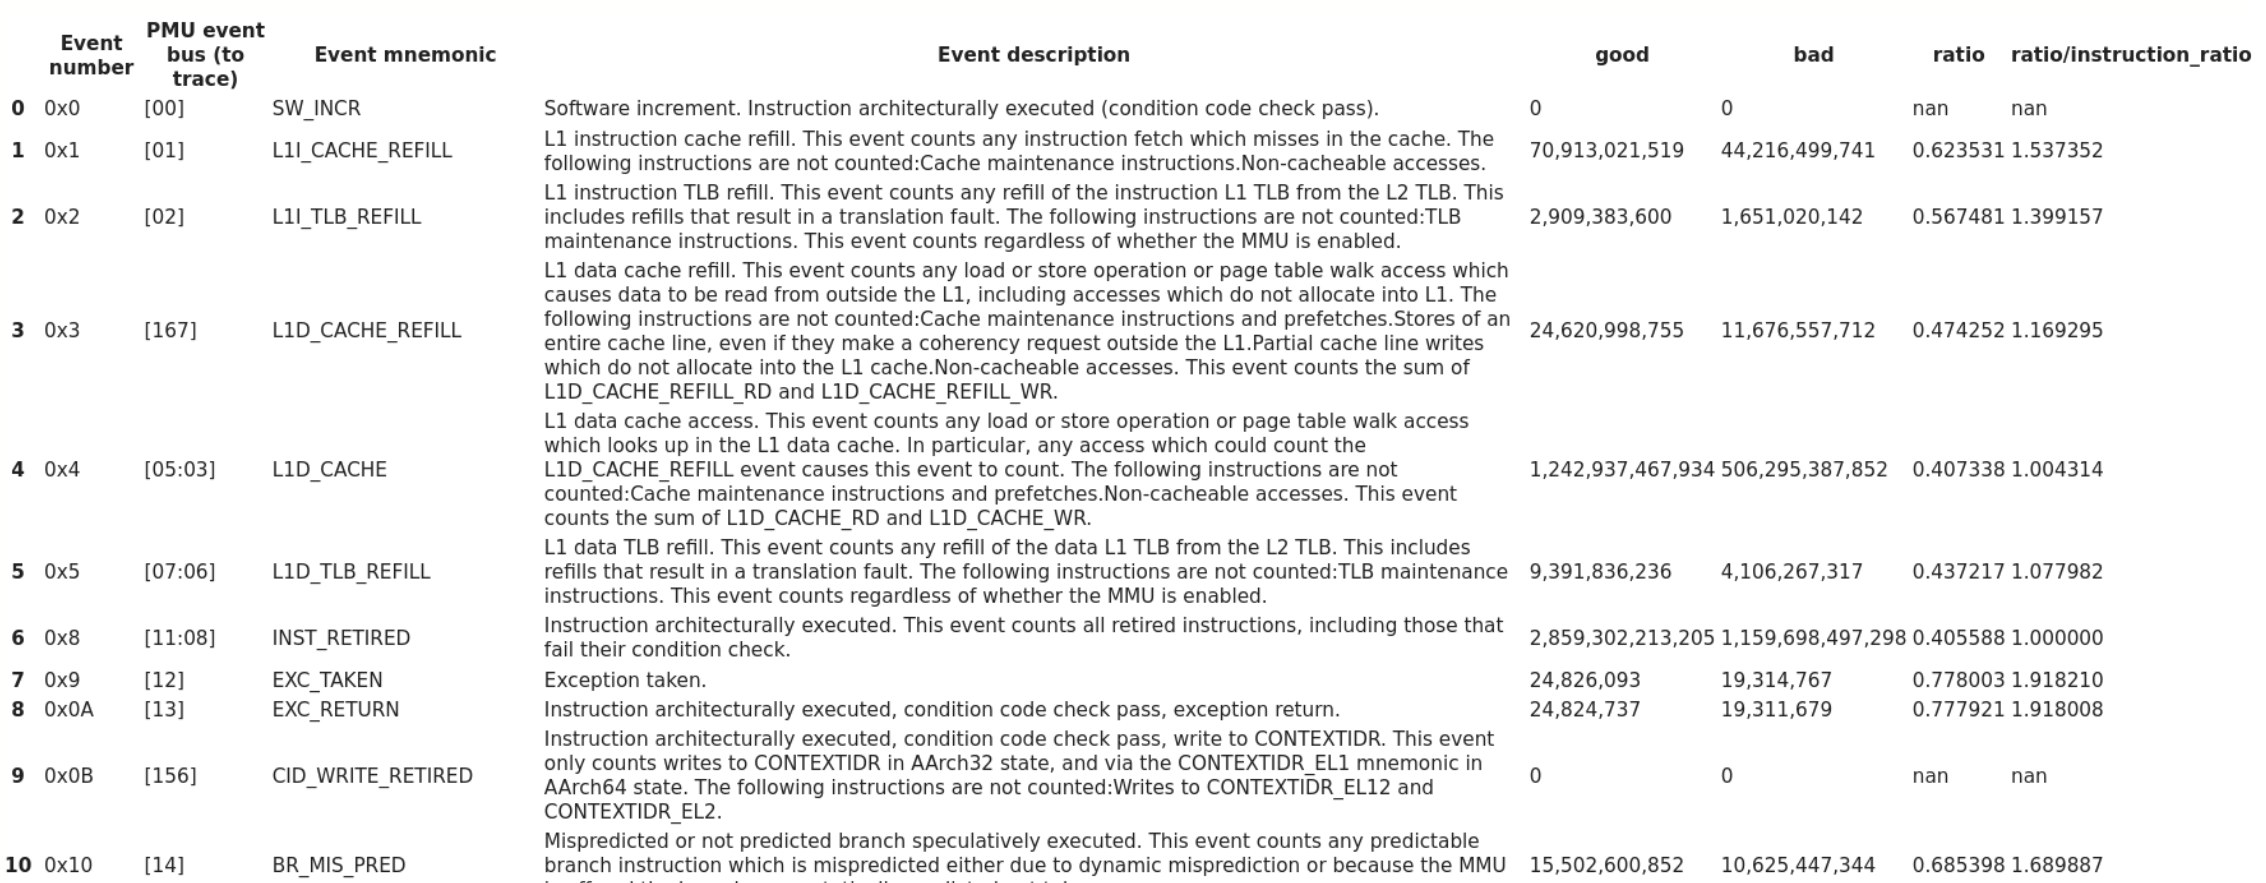
perf stat -x\t produces a tab-separated file. We can load the results into a pretty table:
![]()
Looking at all relevant events, we see that the good case has more cache misses, on all levels. This likely means that the bad case doesn’t have more misses, but the penalty is greater.
The penalty of misses could be caused by increased contention: maybe cores are competing for access to the main memory more severely in the bad case? Let’s check what happens when we run Scylla on a different number of cores:
![]()
![]()
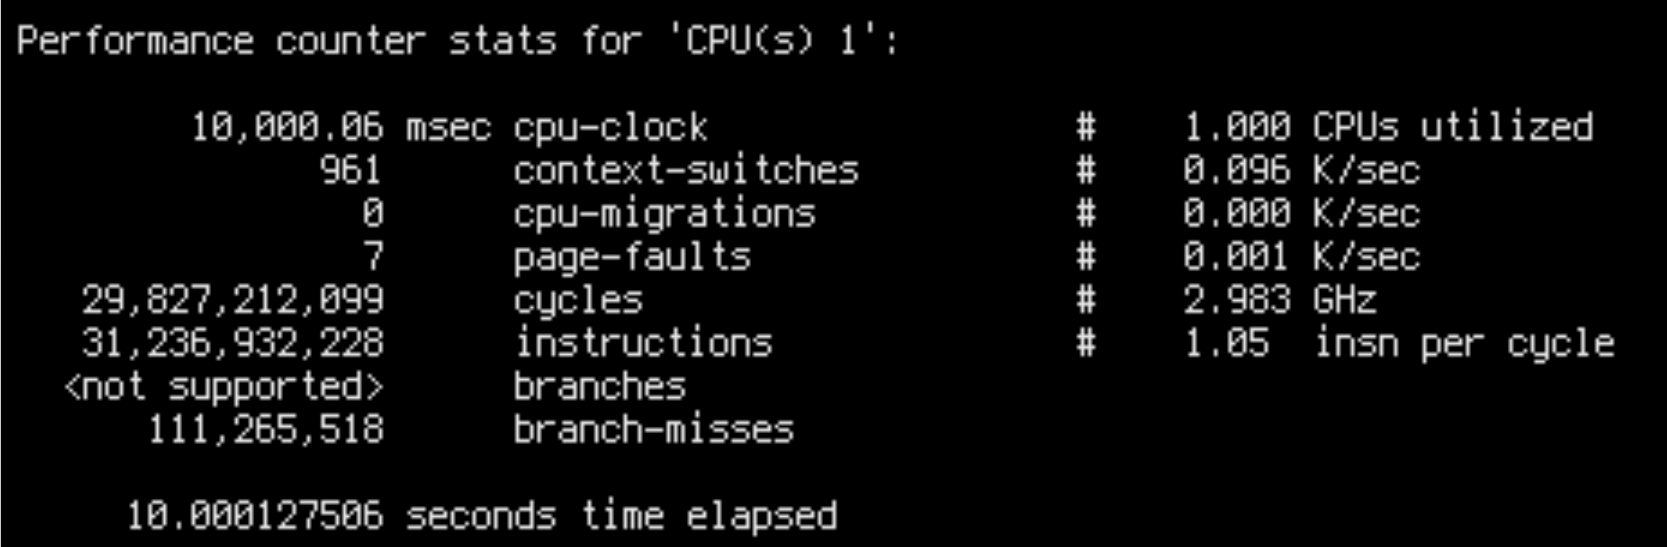
Indeed, the bad run IPC is significantly correlated with the number of used cores: it’s 0.42 for 30 cores, 0.26 for 64 cores. When lowering the number of cores, bad run IPC rises, and stabilises at around 1.0 for 10 cores – for less than 10 cores, bad runs are not visible. The good run IPC is close to 1 for any number of cores.
A very important observation is that all bad runs are hard-bottlenecked at around 500k ops/s, which is reached at around 11 cores. Adding more cores above that does not improve it, only decreases IPC. It is clear that cores are heavily contending for something, but only sometimes. Why? No idea.
Let’s go back to the table again and take a look at all the other events. Maybe we find something that happens more often in the bad case – that would be a good candidate for a bottleneck.
There are a few such events. CPU_CYCLES (obviously, because we were doing the measurement for the same amount of time in both cases), LDREX_SPEC (“exclusive operation speculatively executed” – but since it happens only 1,000 times per second, it can’t possibly be the cause), EXC_UNDEF (“number of undefined exceptions taken locally” – I don’t even know what this means, but it doesn’t seem like a reasonable bottleneck), STALL_BACKEND (this only supports our suspicion that the CPU is bottlenecked on memory somehow), and REMOTE_ACCESS.
NUMA
![]()
REMOTE_ACCESS is suspicious. Why do we need to access the other socket at all? Scylla is NUMA aware – Seastar binds the memory for each shard to the CPU socket where the shard is running. And even if it wasn’t doing that, by default Linux allocates memory for new pages on the socket where the page fault came from. Shards should only be causing page faults in their own memory, so there should be no remote socket accesses. Besides, we are running the benchmarks on 32 cores, all of which are on socket 0, so even if shards shared some memory, it would be on the same socket. Perhaps remote accesses happen in kernel space?
Let’s take a look:
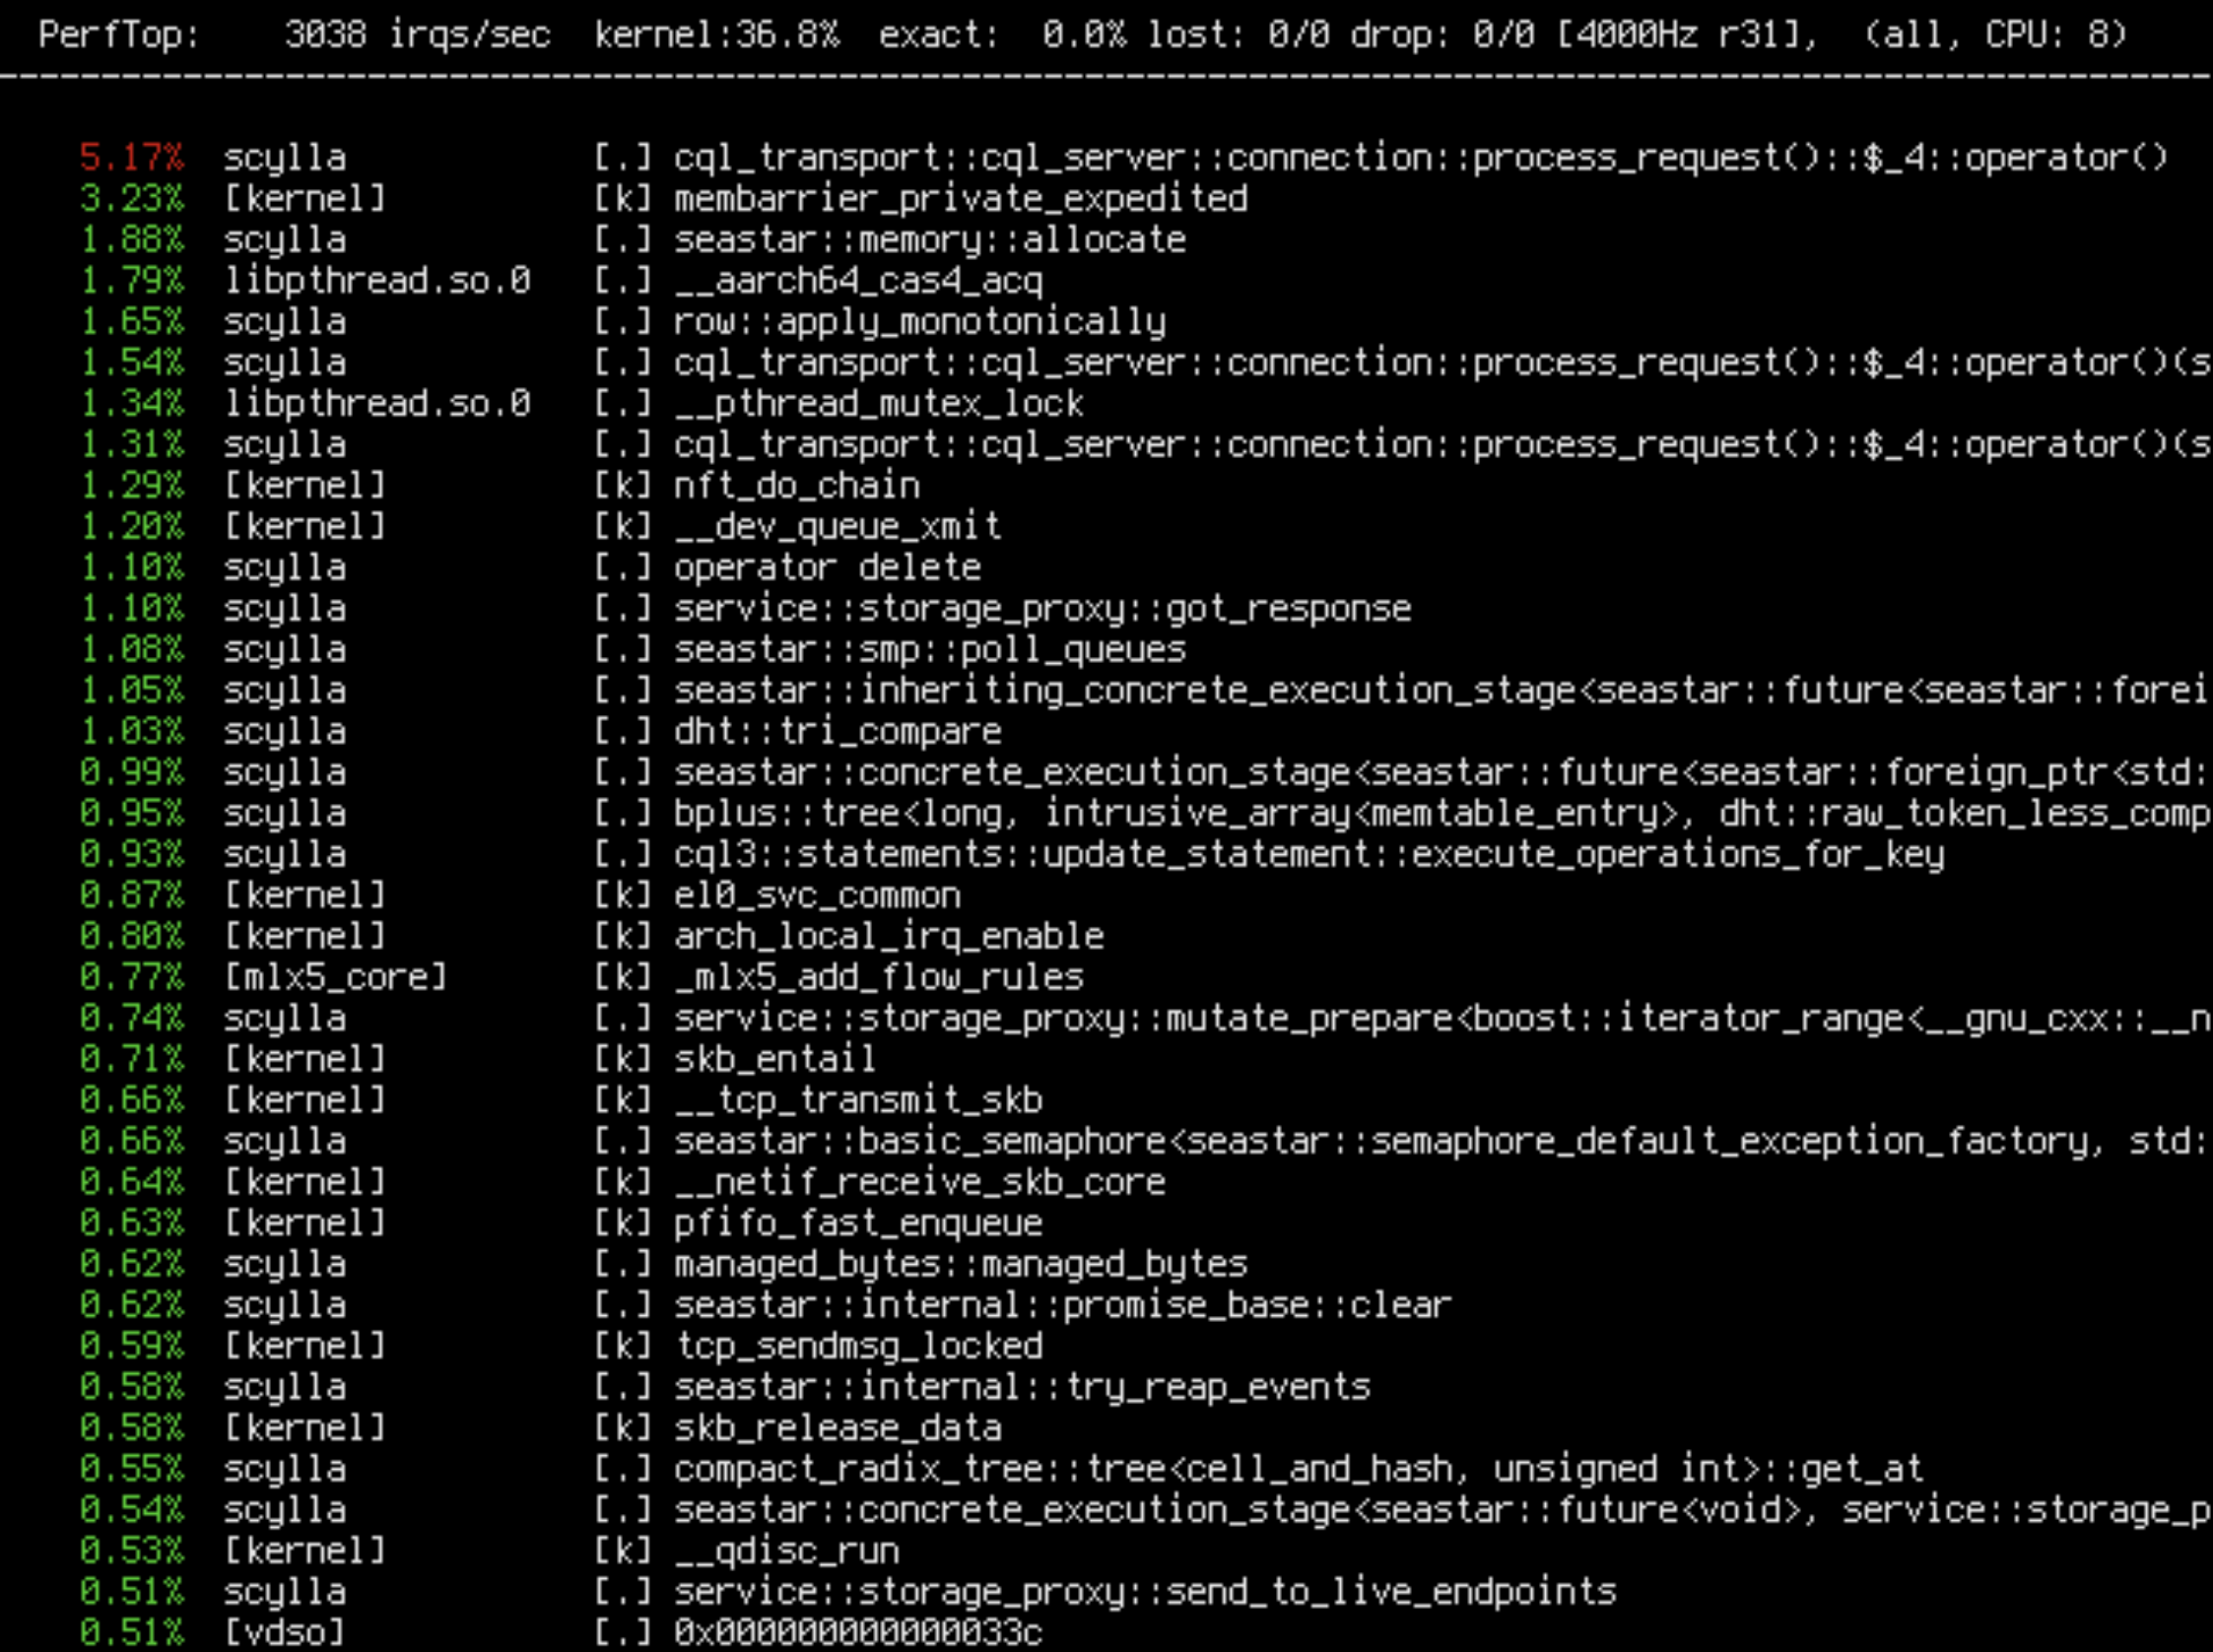
sudo perf top -C8 -e r31
![]()
Apparently only 36% of remote accesses are happening in the kernel, but others are from Scylla! How can this be? Maybe a binding went wrong. Let’s check numa_maps, which shows the NUMA stats and policy for all memory mappings in the process:
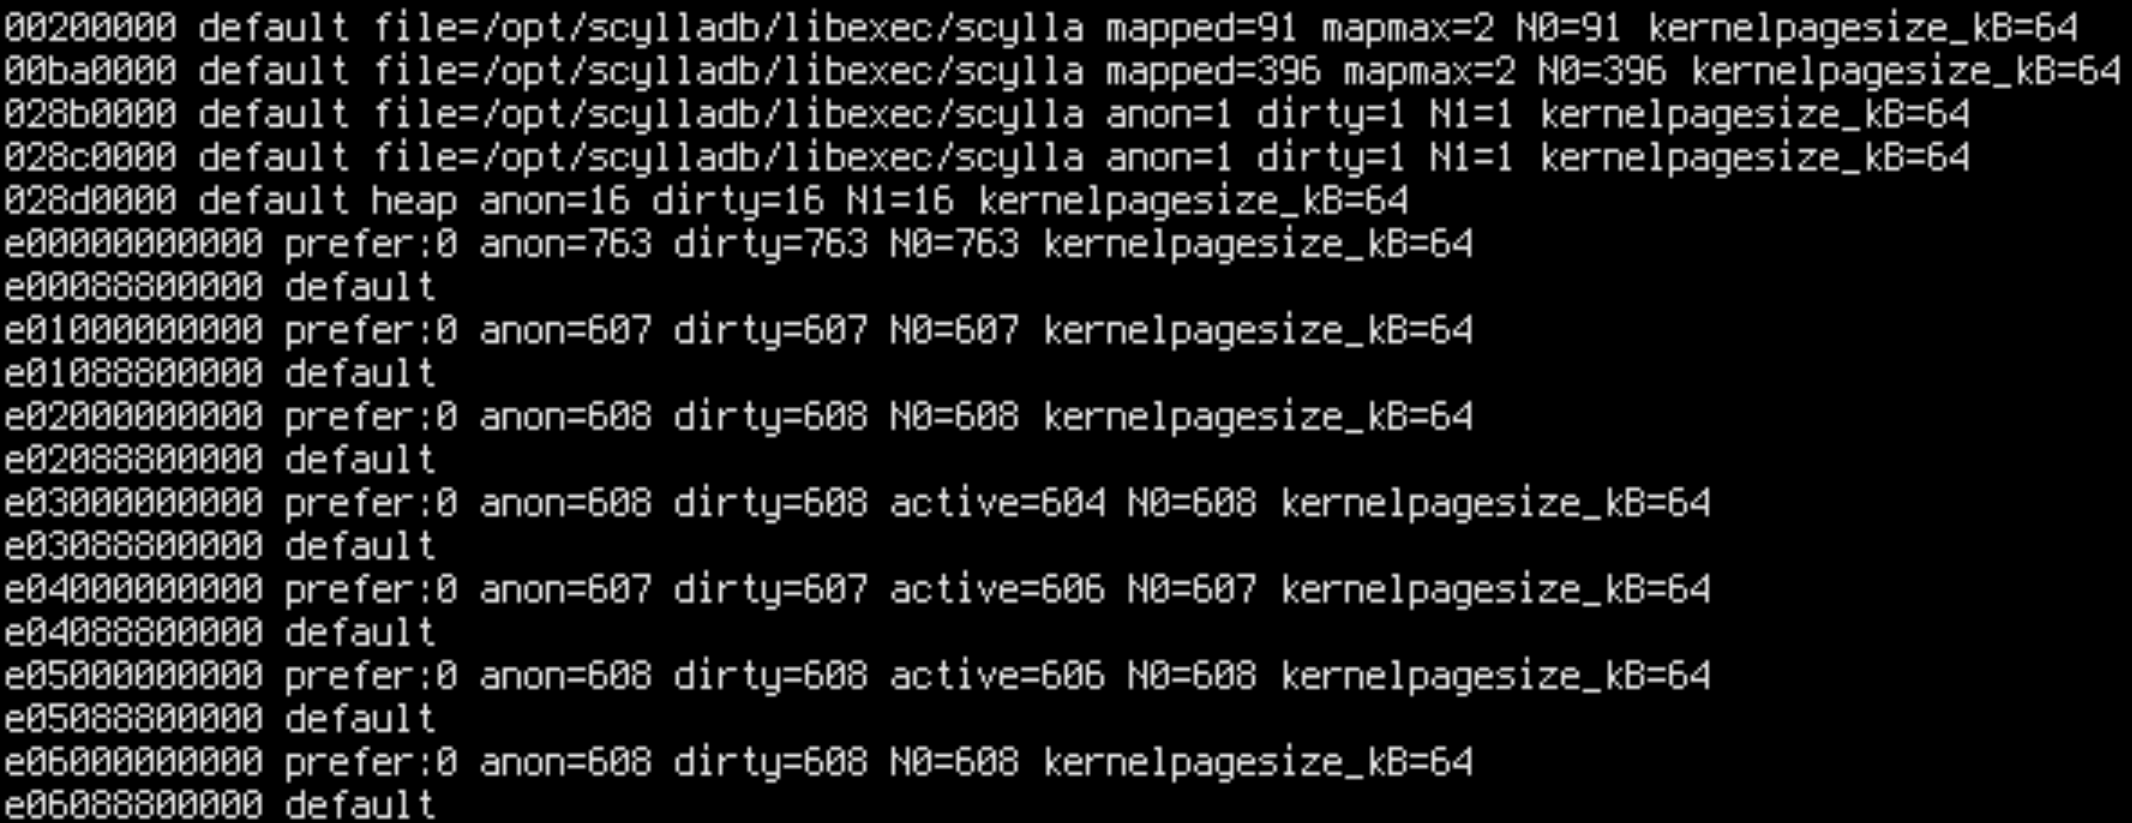
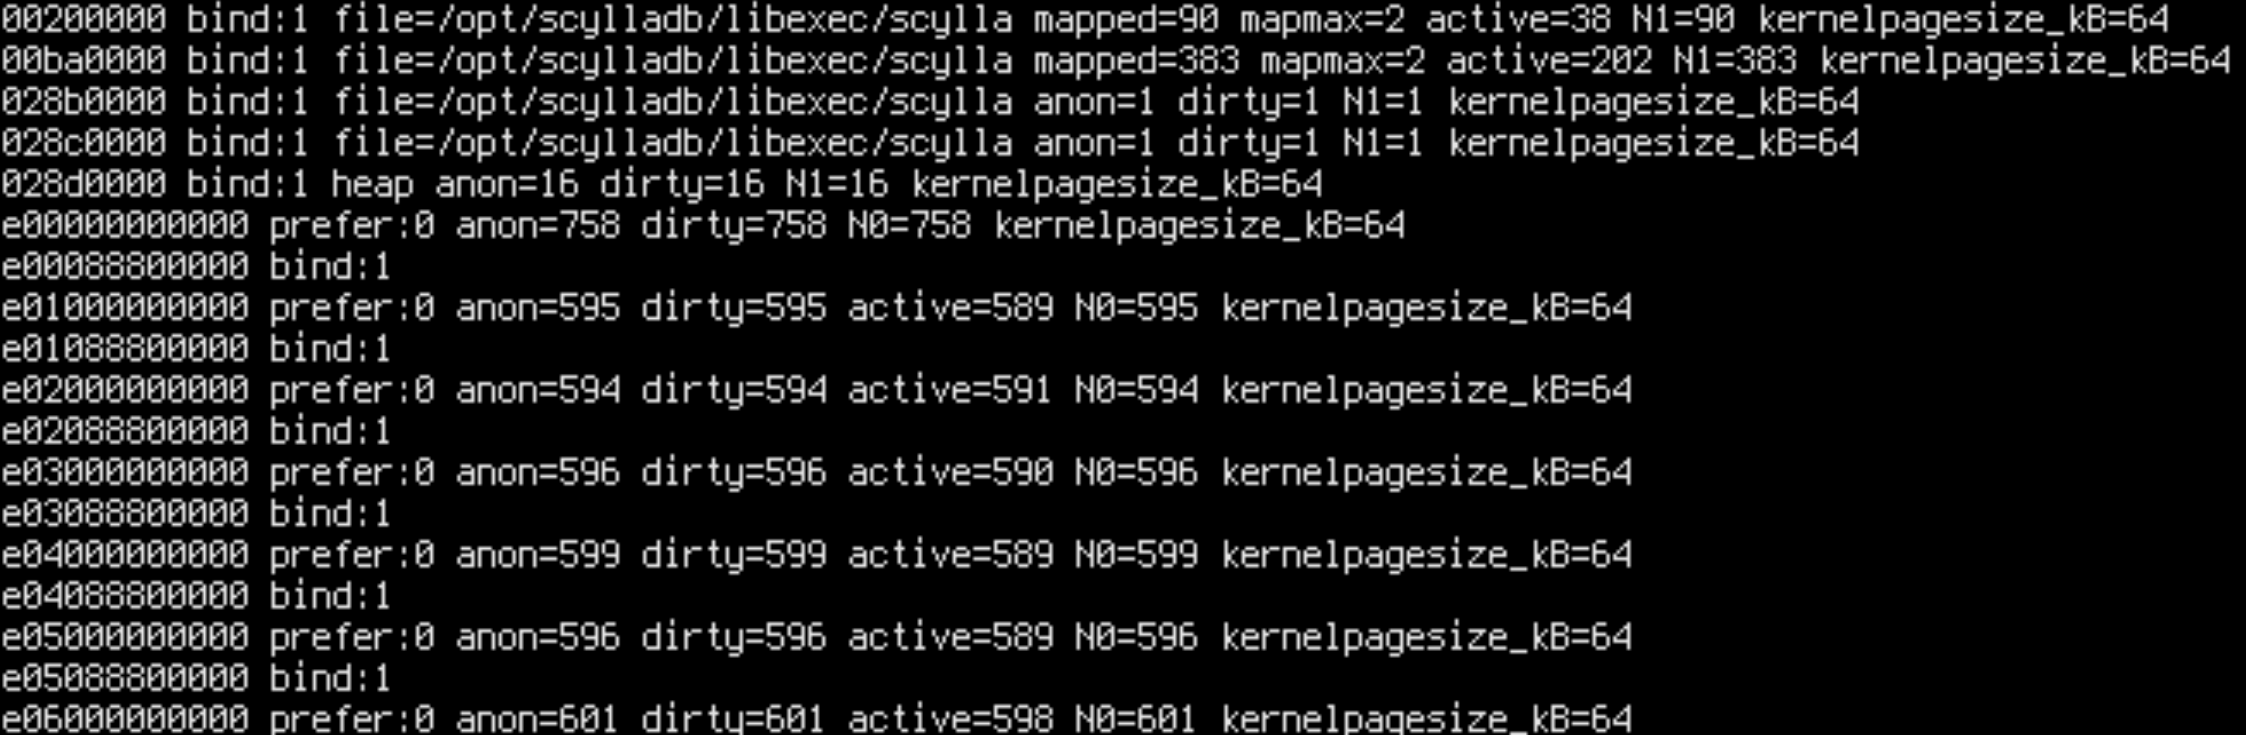
sudo cat /proc/$(pgrep -x scylla)/numa_maps
![]()
Aha! We forgot that shards are sharing some memory: the static memory. .text, .bss, .data are used by all shards. Normally, we would expect such memory to be read-only or read-mostly since the Seastar architecture eschews shared atomic variables in favor of per-core dedicated memory for writeable variables, but perhaps we violated this principle.
N0=x N1=y means that x pages in the address range are allocated on node 0 and y pages are allocated on node 1. By cross-referencing readelf --headers /opt/scylladb/libexec/scylla we can determine that .text, .rodata and other read-only sections are on node 0, while .data, .bss and other writable sections are on node 1.
![]()
That’s what remote accesses are coming for. Could that be the cause of performance problems?
We can test this by forcing memory to a given NUMA node by running the executable under numactl. Let’s prepend /usr/bin/numactl --membind 1 to /usr/bin/scylla scylla_args…:
sudo systemctl edit --full scylla-server
sudo systemctl restart scylla-server
![]()
Oops, we wanted to bind everything to node 1, but some parts of the executable (.text) are still on node 0. That’s because Linux consults the memory policy only when pages are allocated – but .text is already allocated in the page cache. If we want to force .text to node 1 too, we can stop Scylla, drop the page cache, and try again.
sudo systemctl stop scylla-server
echo 3 | sudo tee /proc/sys/vm/drop_caches
sudo systemctl start scylla-server
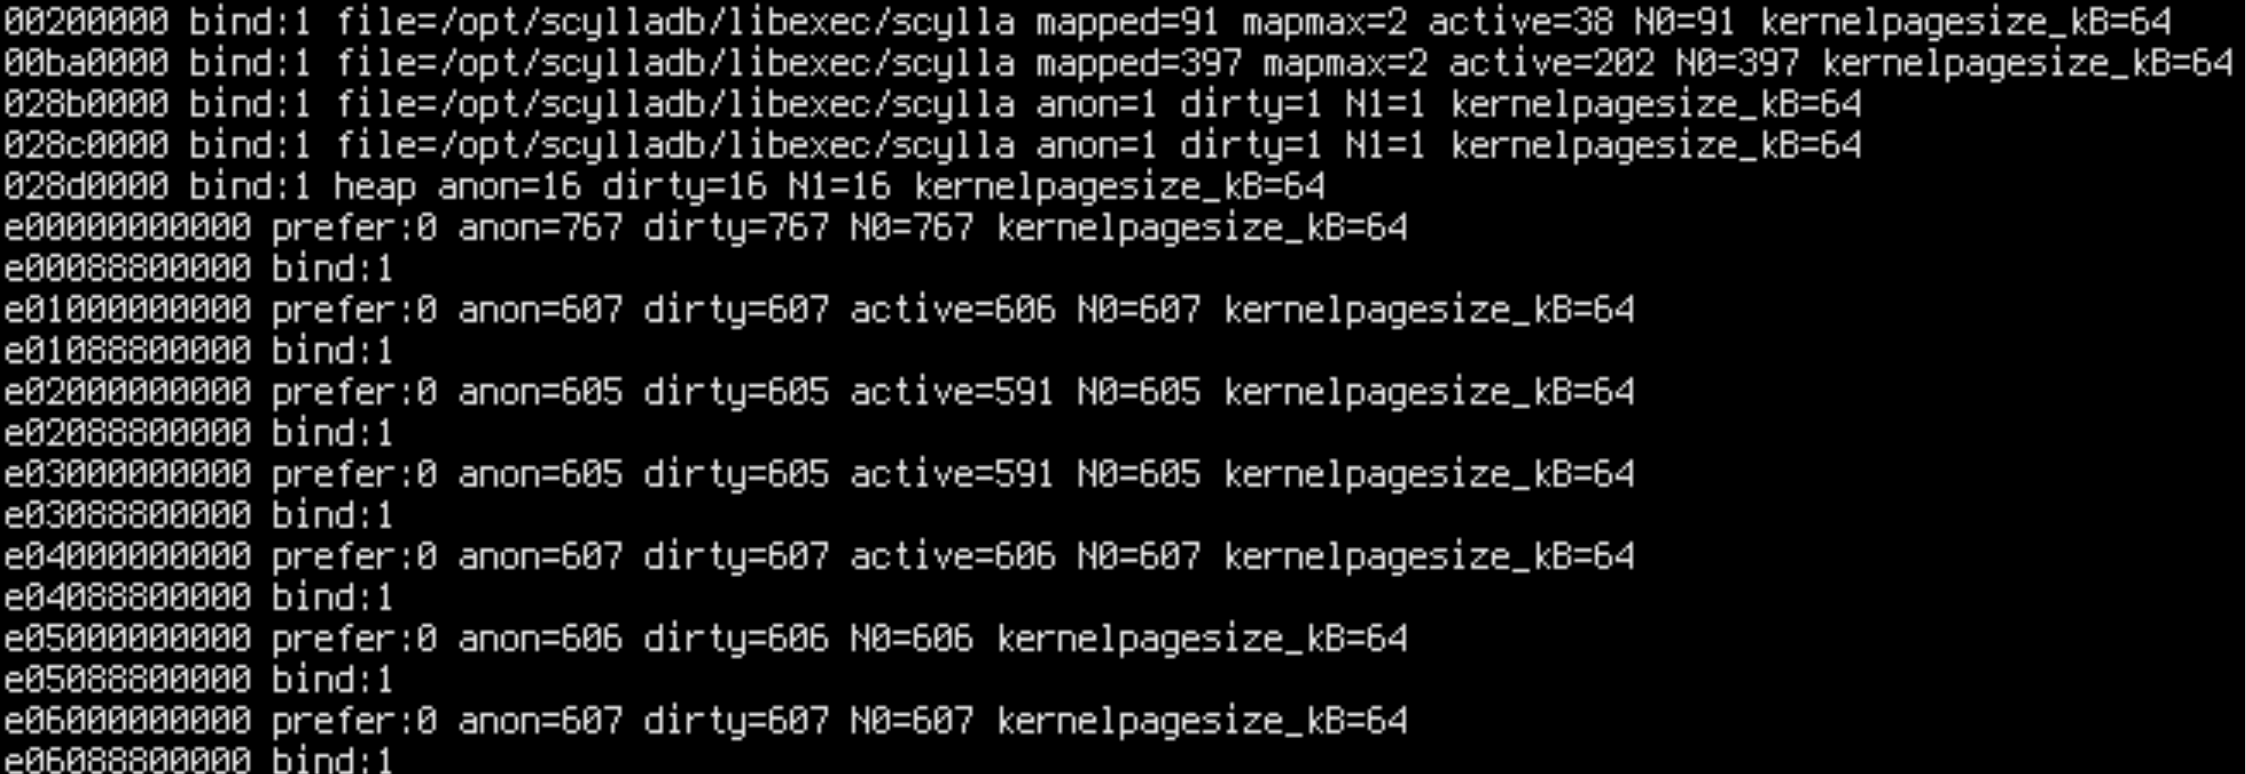
![]()
Now everything is on node 1.
Let’s try running the benchmark a few times with everything on node 0 and then with everything on node 1. Aaand… that’s it! Every run with data on node 0 is fast and every run with data on node 1 is slow.
We have learned that remote memory accesses are the bottleneck. Now we have to understand why.
If you are wondering why .data and .bss sometimes land on node 0 and sometimes on node 1: this is determined by the core where Scylla happens to be started on. When Scylla is launched, Linux schedules it on an arbitrary core – sometimes on node 0, sometimes on node 1. During startup, .data and .bss are touched, causing a page fault, and in accordance with the default policy they are allocated on the NUMA node which contains this core. Only later Scylla launches shard threads and binds them to cores chosen by the user.
Finding the Source of NUMA Problems
To dig further, we want something more granular than numactl, which causes all memory to be allocated on a given node. We have to use mbind() – a Linux call which allows setting NUMA memory policy for an address range. With the MF_MOVE_ALL flag it also allows moving already allocated memory between nodes.
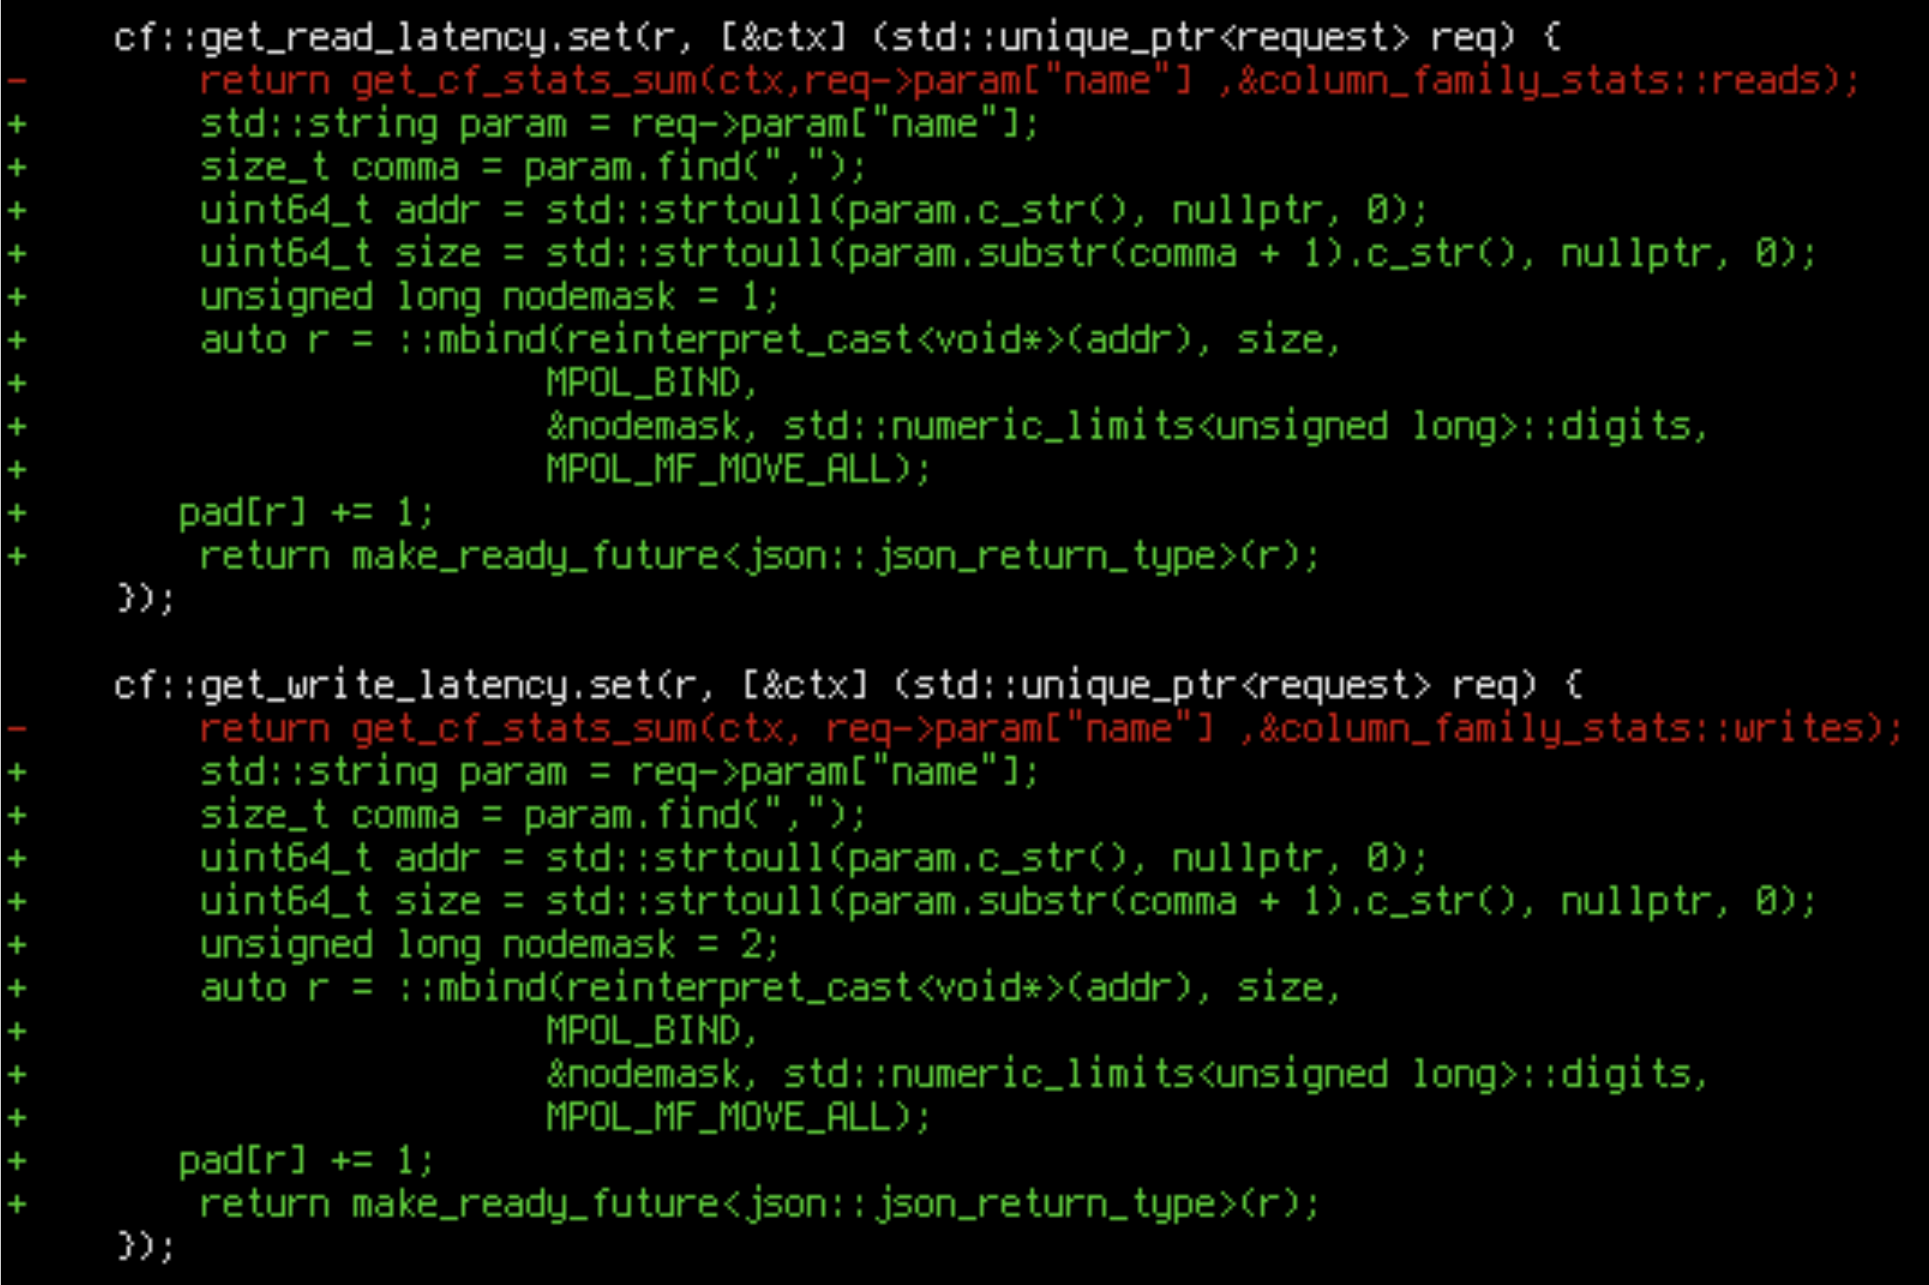
Let’s add a way of asking Scylla to call mbind(). We can modify Scylla’s REST API for that. Since we are too lazy to add a new call, let’s just hijack an existing one:
![]()
We have hacked mbind() into a random API call. Now we can
curl http://localhost:10000/column_family/metrics/write_latency/0x028b0000,0x10000
to move arbitrary page ranges between nodes.
Using this ability, we discover that only one page matters: 0x28c0000, which contains .data, .got.plt and the beginning of .bss. When this page is on node 1, the run is slow, even if all other pages are on node 0. When it’s on node 0, the run is fast even if all other pages are on node 1.
Remote accesses to memory only happen after L2 cache misses. There are two possible causes of cache misses: aliasing and invalidation. If they happen because of aliasing, this means Scylla is naturally accessing enough memory that all important lines can’t fit in the cache. That would be rather hard to deal with – perhaps it would require re-architecturing the program to get rid of global variables.
But maybe we are accidentally invalidating a cache line. If that’s the case, we should be able to find it. But mbind() won’t allow us to test areas more granular than a page, so we have to improvise.
If we could manipulate the layout of the executable, we could move the suspicious area by just enough bytes to split it in half with a page boundary. We can then check which half is bad by sending one half to the remote node (together with the surrounding page).
If we repeat this bisection enough times, we will find the problematic cache line.
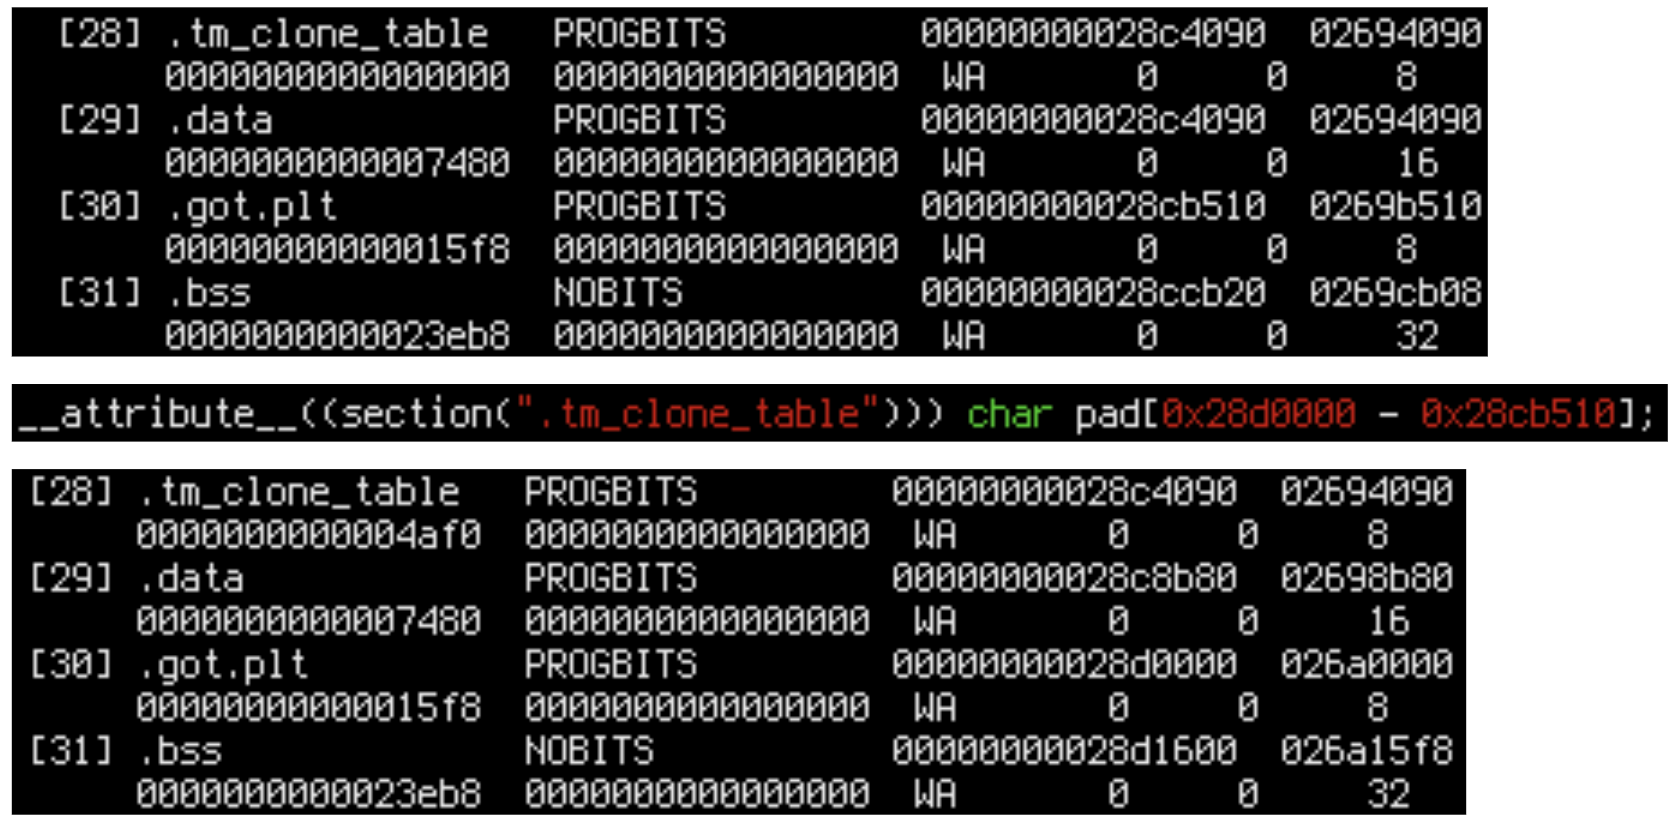
We can move the suspicious area by stuffing some padding before it. .tm_clone_table seems like a good enough place to do that. We can add an array in .tm_clone_table somewhere in Scylla and recompile it. (By the way, note that our hacked-in mbind API writes something to this array to prevent it from being optimized out. If it wasn’t used, the linker would discard it, because Scylla is compiled with -fdata-sections).
Let’s try to pad .got.plt to a page boundary to test this hack.
![]()
It works – we can manipulate the layout. Now we have to repeat this 10 times to find the culprit.
The Fix
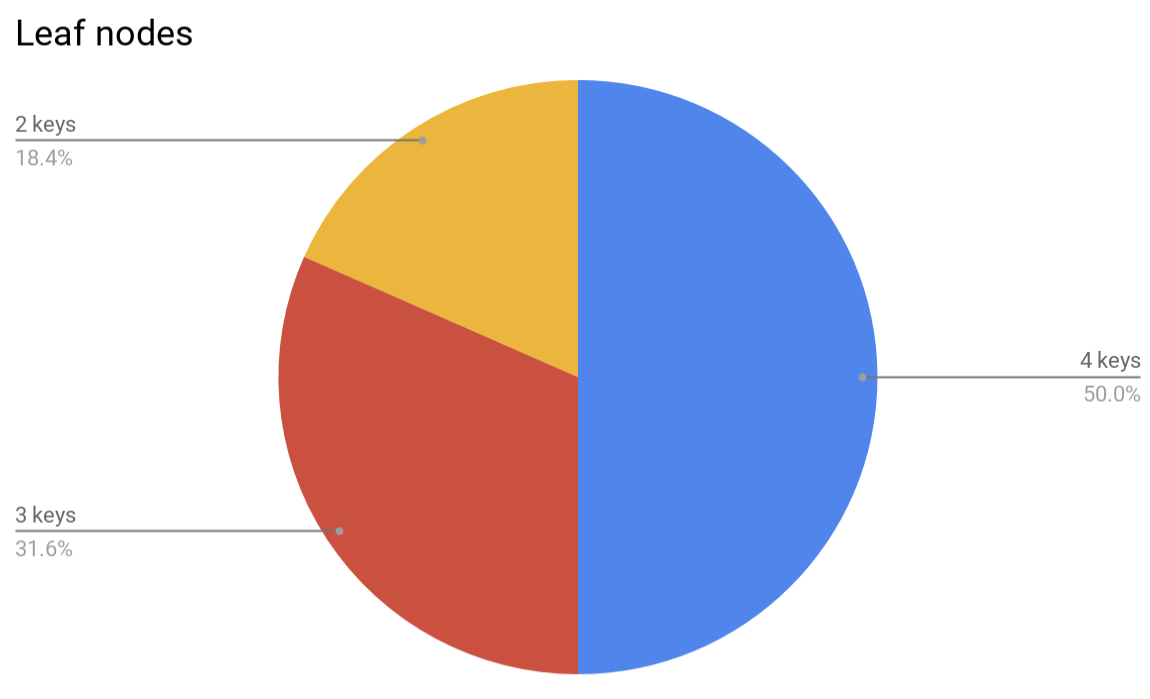
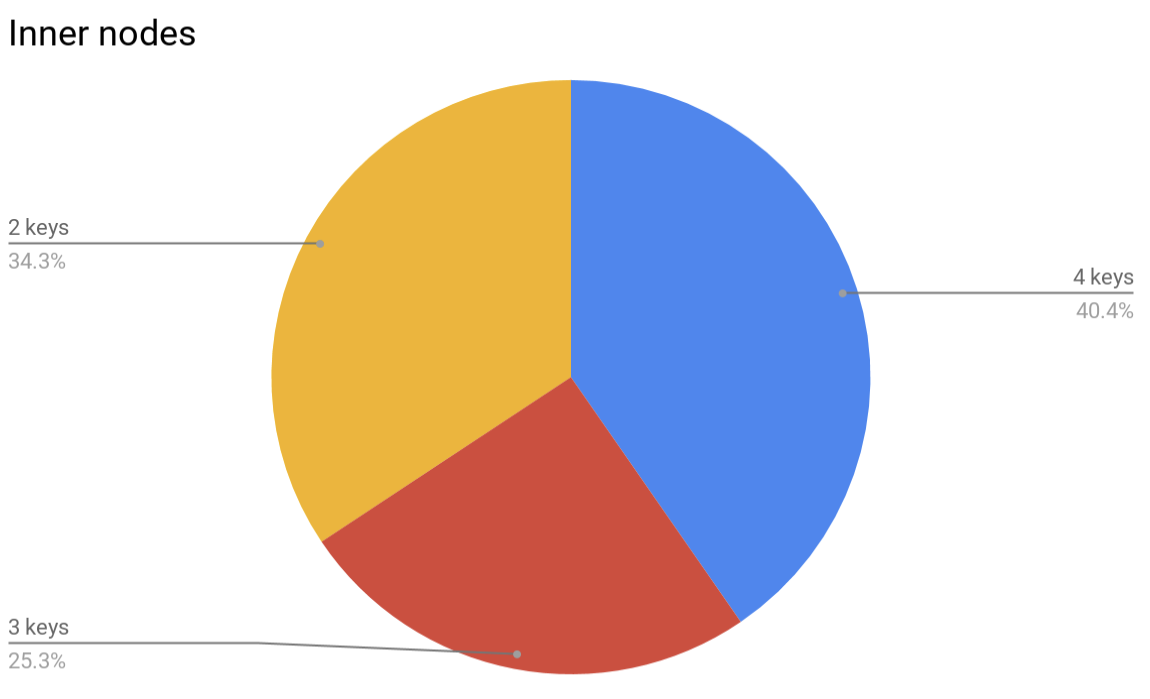
Eventually we narrow the search to bytes 0x380–0x400 of .bss. We can’t go further because .bss is aligned to 32. Let’s use gdb to see how those bytes are used:
sudo gdb -p (pgrep -x scylla)
(gdb) watch *0x28d0000
(gdb) watch *0x28d0008
(gdb) watch *0x28d0010
(gdb) watch *0x28d0018
(gdb) continue
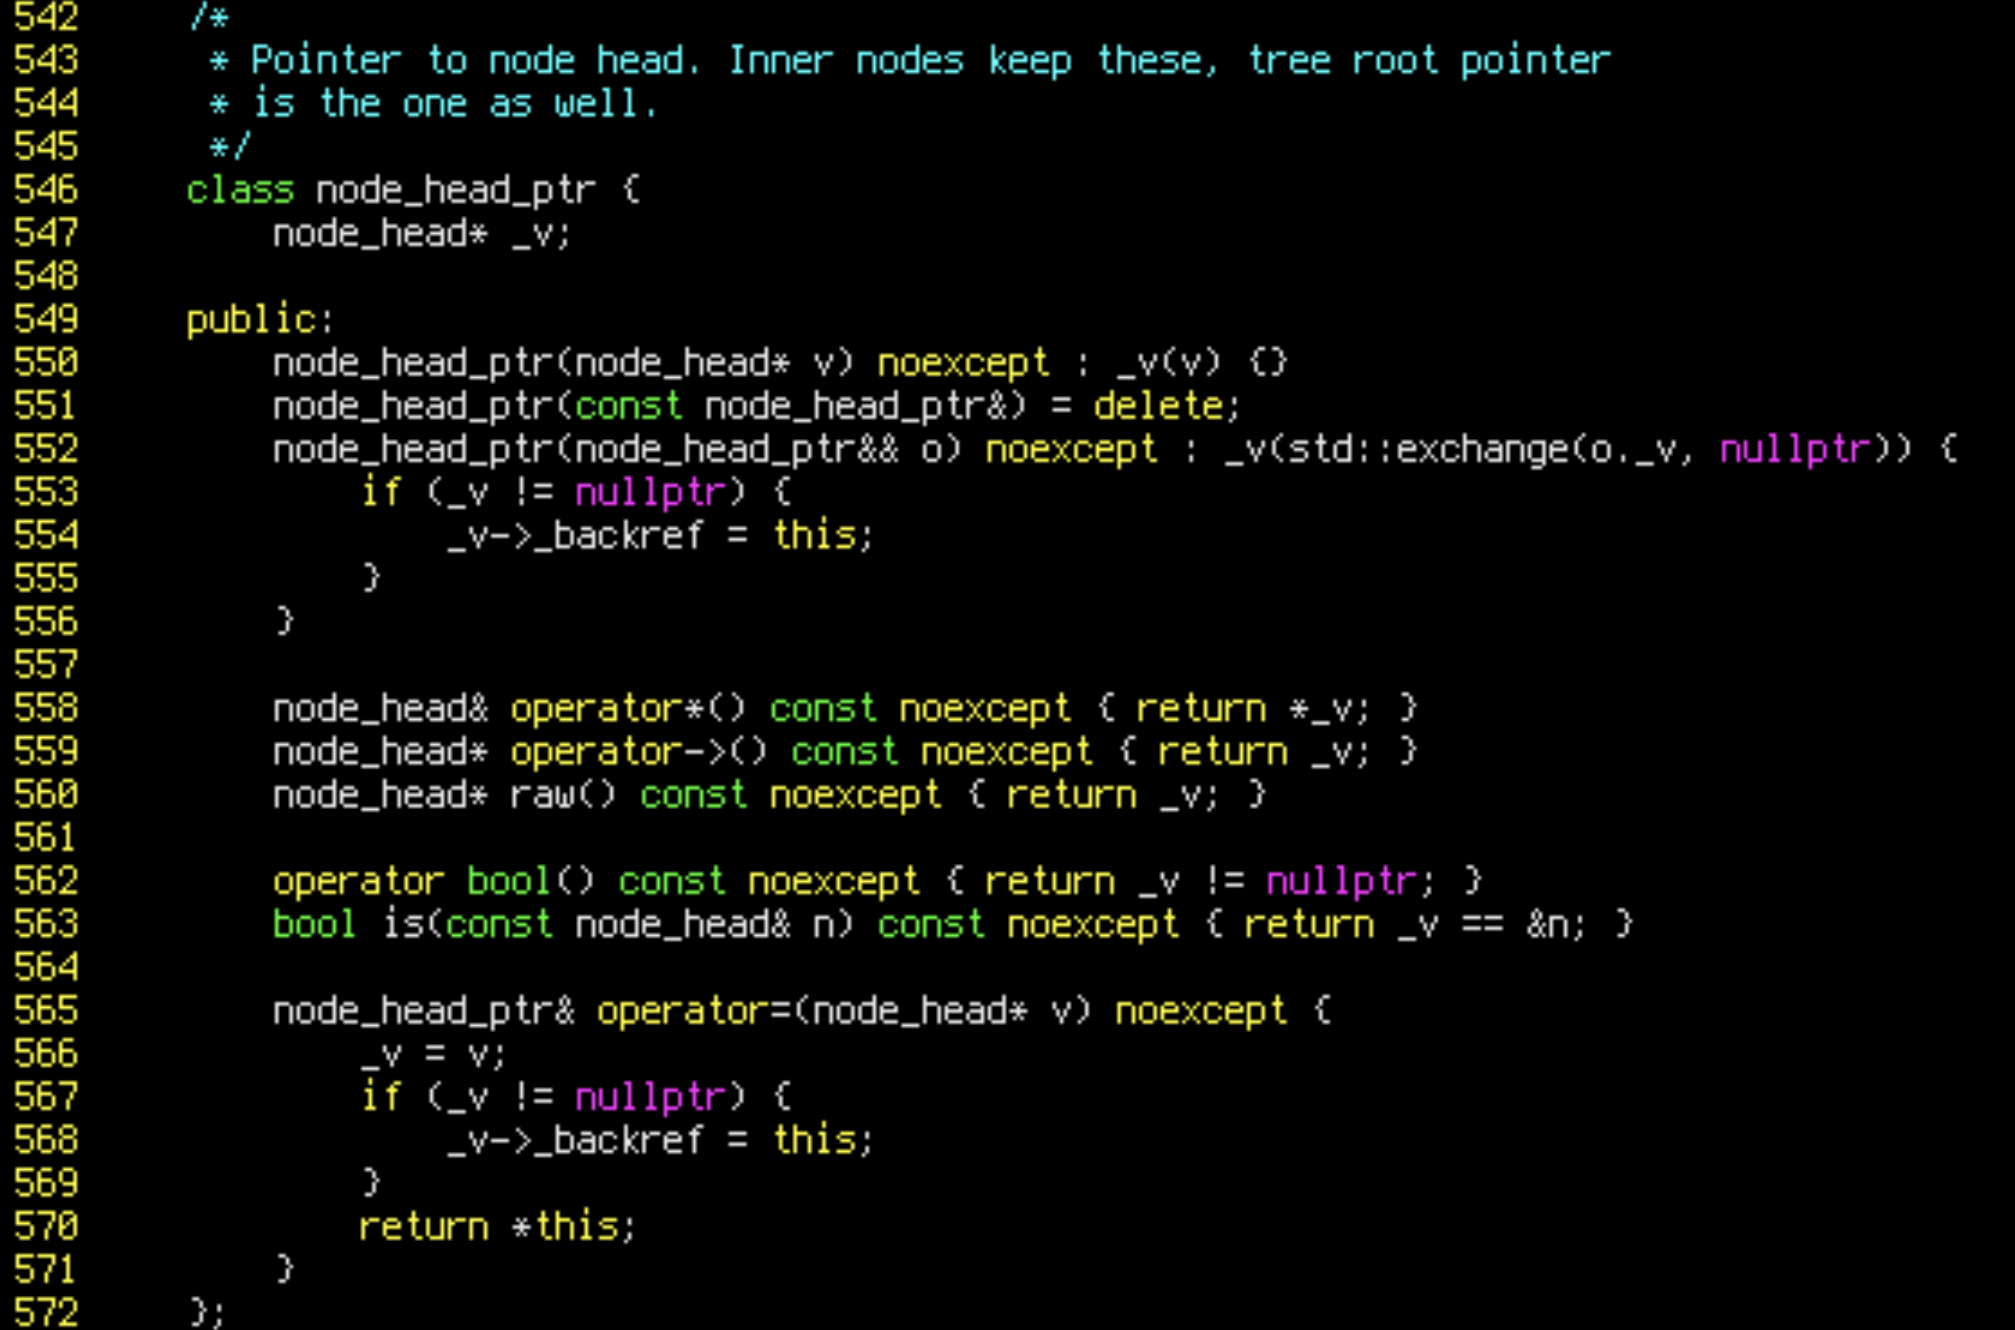
When we run the benchmark with those watchpoints, we see that only 0x28d0000 is written to. This happens in line 568 of compact-radix-tree.hh:
![]()
And what’s under the problematic address?
(gdb) info symbol 0x28d0000
![]()
This explains everything.
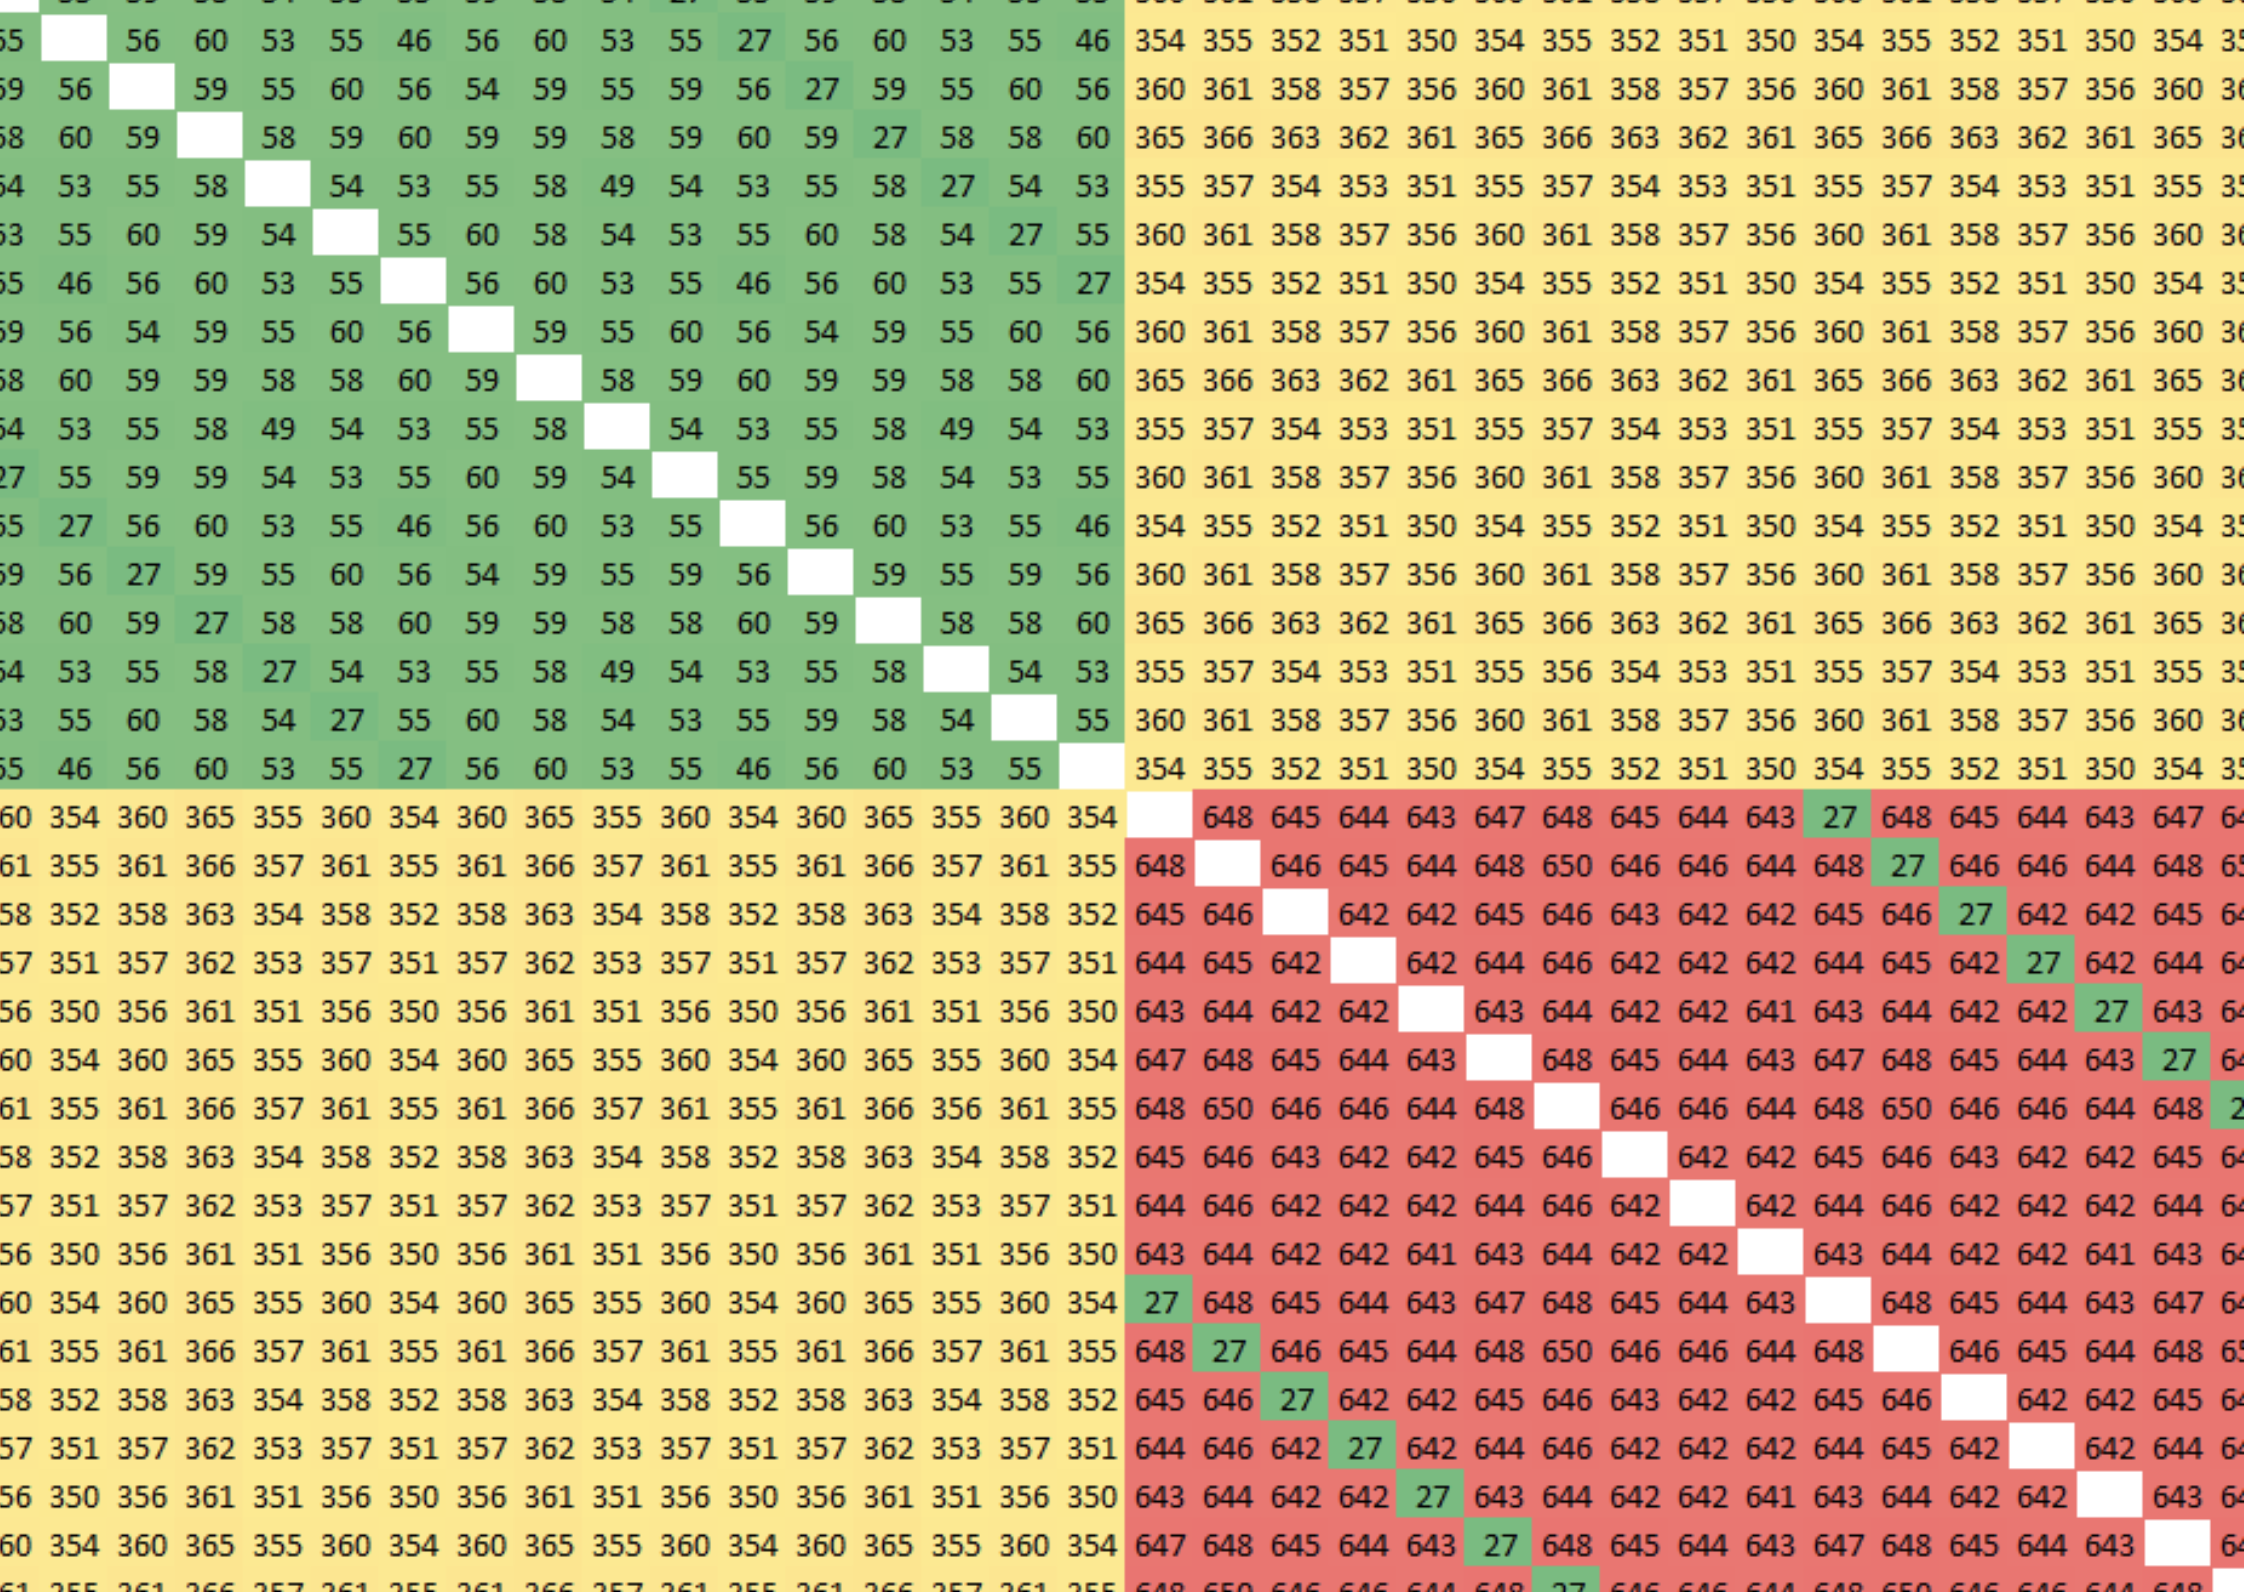
nil_root is a special, global tree node, used as a guard in tree algorithms. However, this trick had an unintended side effect. node_head_ptr is a pointer which automatically updates the backreference in the target of assignment. Whenever it was assigned to nil_root, it wrote something to a shared cache line. This resulted in inter-node cache thrashing, which is very costly: according to https://www.anandtech.com/show/16315/the-ampere-altra-review/3, about 2,000 cycles per write!
![]()
Special casing nil_root fixes our performance problem:
https://github.com/scylladb/scylla/commit/126baa7850e185908681be219a37dc7ce7346c14
Hindsight
I later measured that the problematic assignment to nil_root happens about 3 times per query.
With 3e9 cycles per second, 3 invalidations per query and 2e3 cycles per invalidation, we can estimate a bottleneck of 3e9/3/2e3 = 500,000 queries per second. This matches the observed result quite closely.
With full knowledge, we can now understand the cycle flamegraph more. It wasn’t lying: the instructions highlighted by perf annotate really had something special about them: they were loading from the thrashed cache line.
(gdb) info address dblog
![]()
The tree node load instruction was so slow because it was loading nil_root. The log level load was so slow because it happened to be on the same cache line.
Even though the log level load was used only in a perfectly predictable comparison, speculative execution couldn’t hide it because the latency of NUMA accesses is too high for it to handle. 2,000 cycles is more than enough to exhaust all available space in the reorder buffer, which nowadays is a few hundred instructions.
However, the suspicious load instructions weren’t the bottleneck – when we removed one of them, nothing improved. The real culprit was invisible, and its performance penalty was spread over the entire program.
So one important lesson from this case is this: a single innocent CPU instruction brought down the performance of the entire system by more than 50%, yet it was impossible to detect by sampling. Invalidating cache is fast in itself; the penalty is visible elsewhere, and can be hard to connect to the cause.
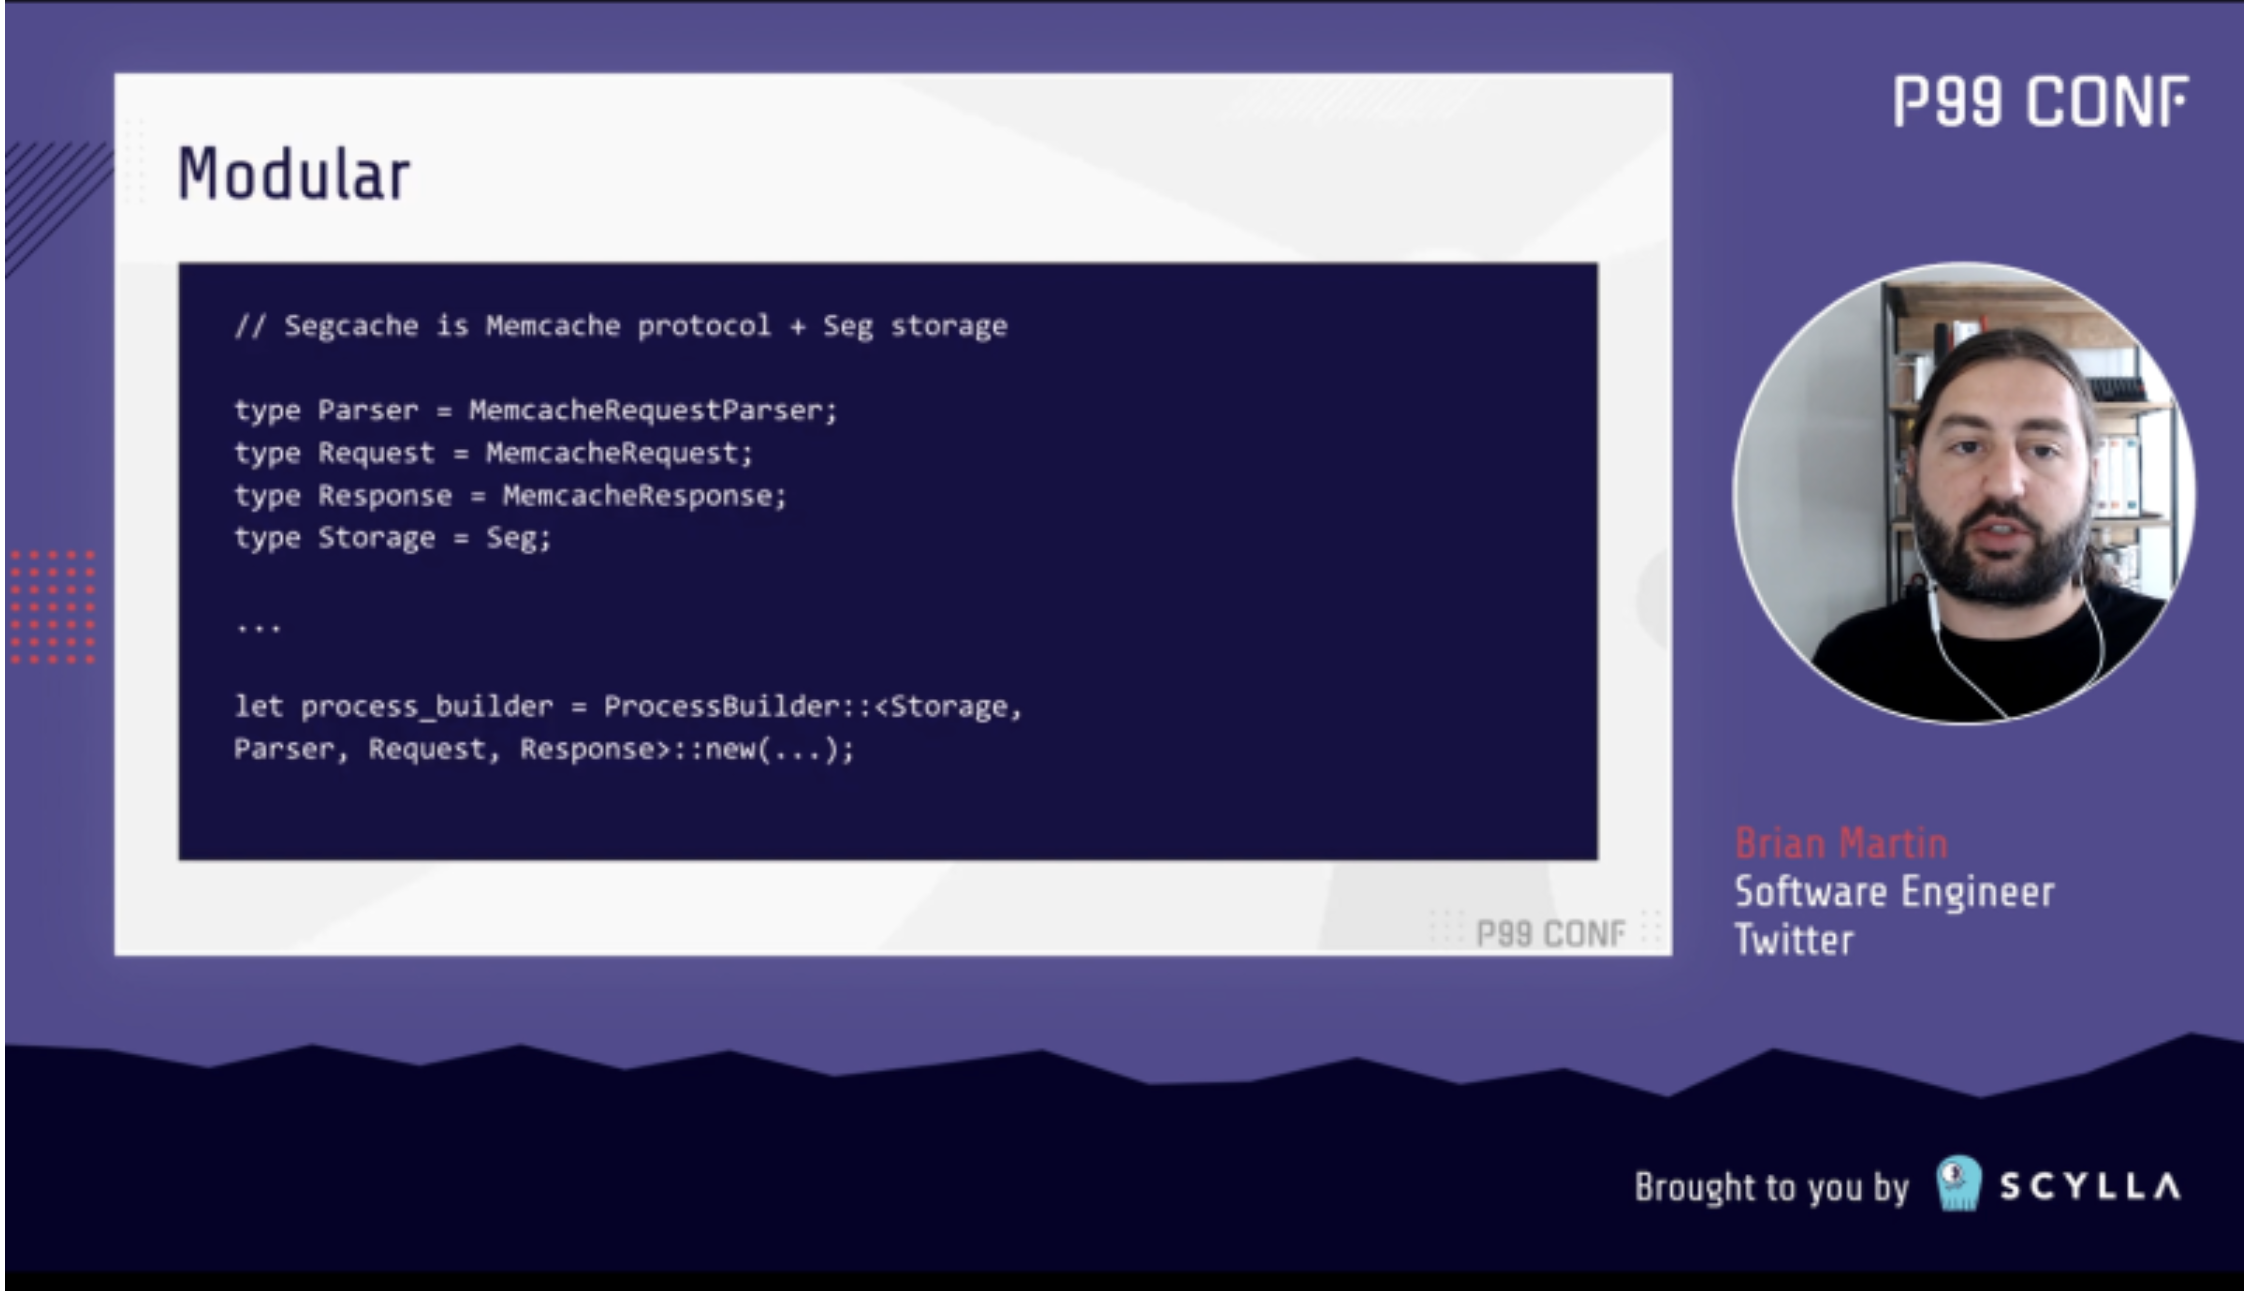
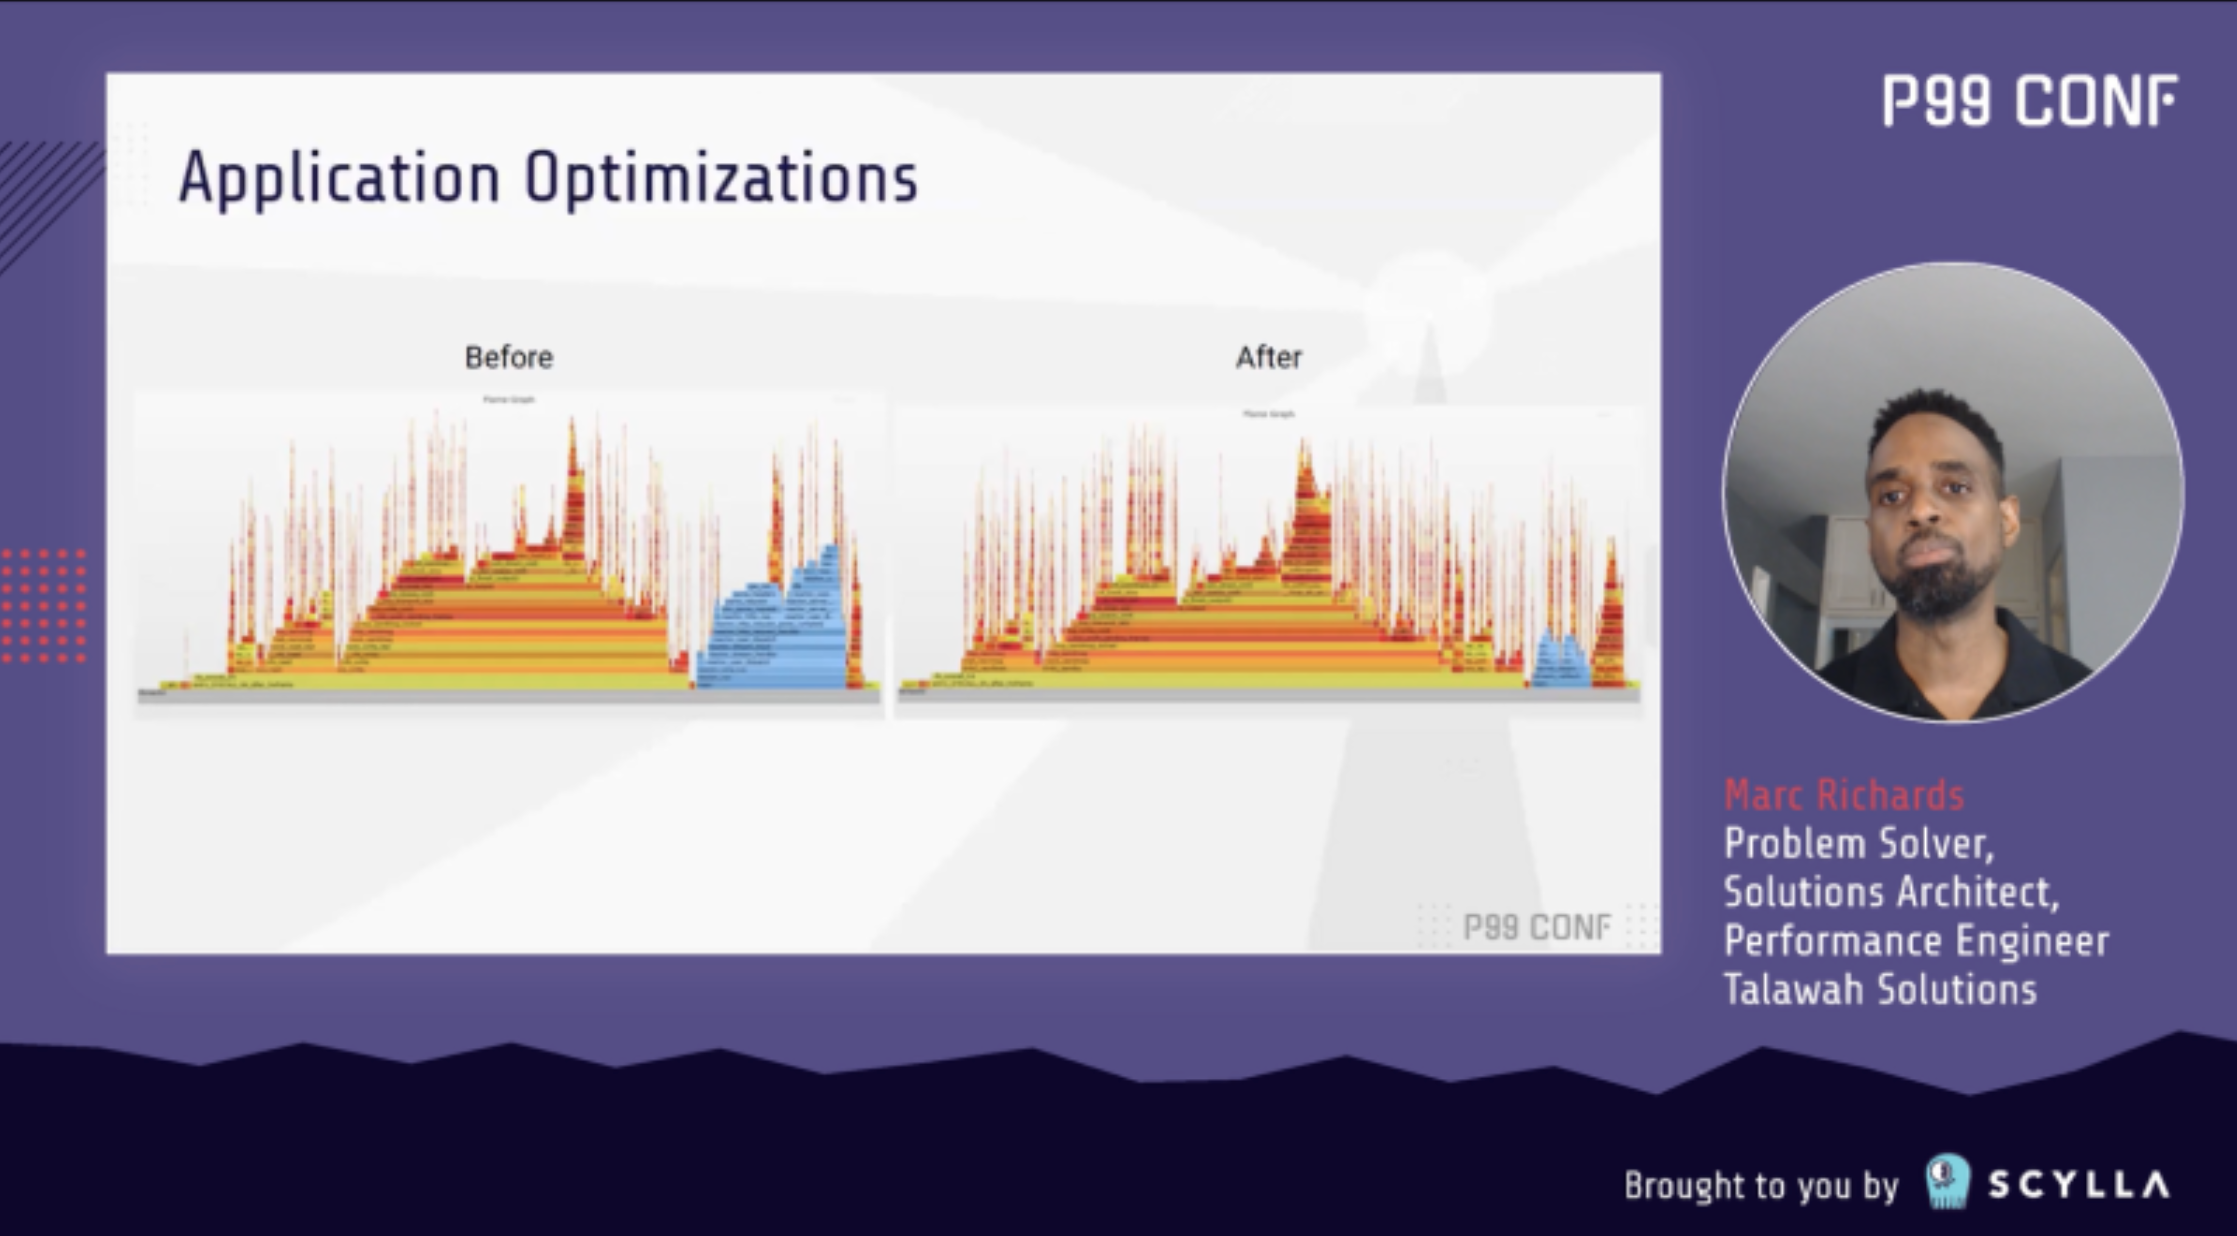
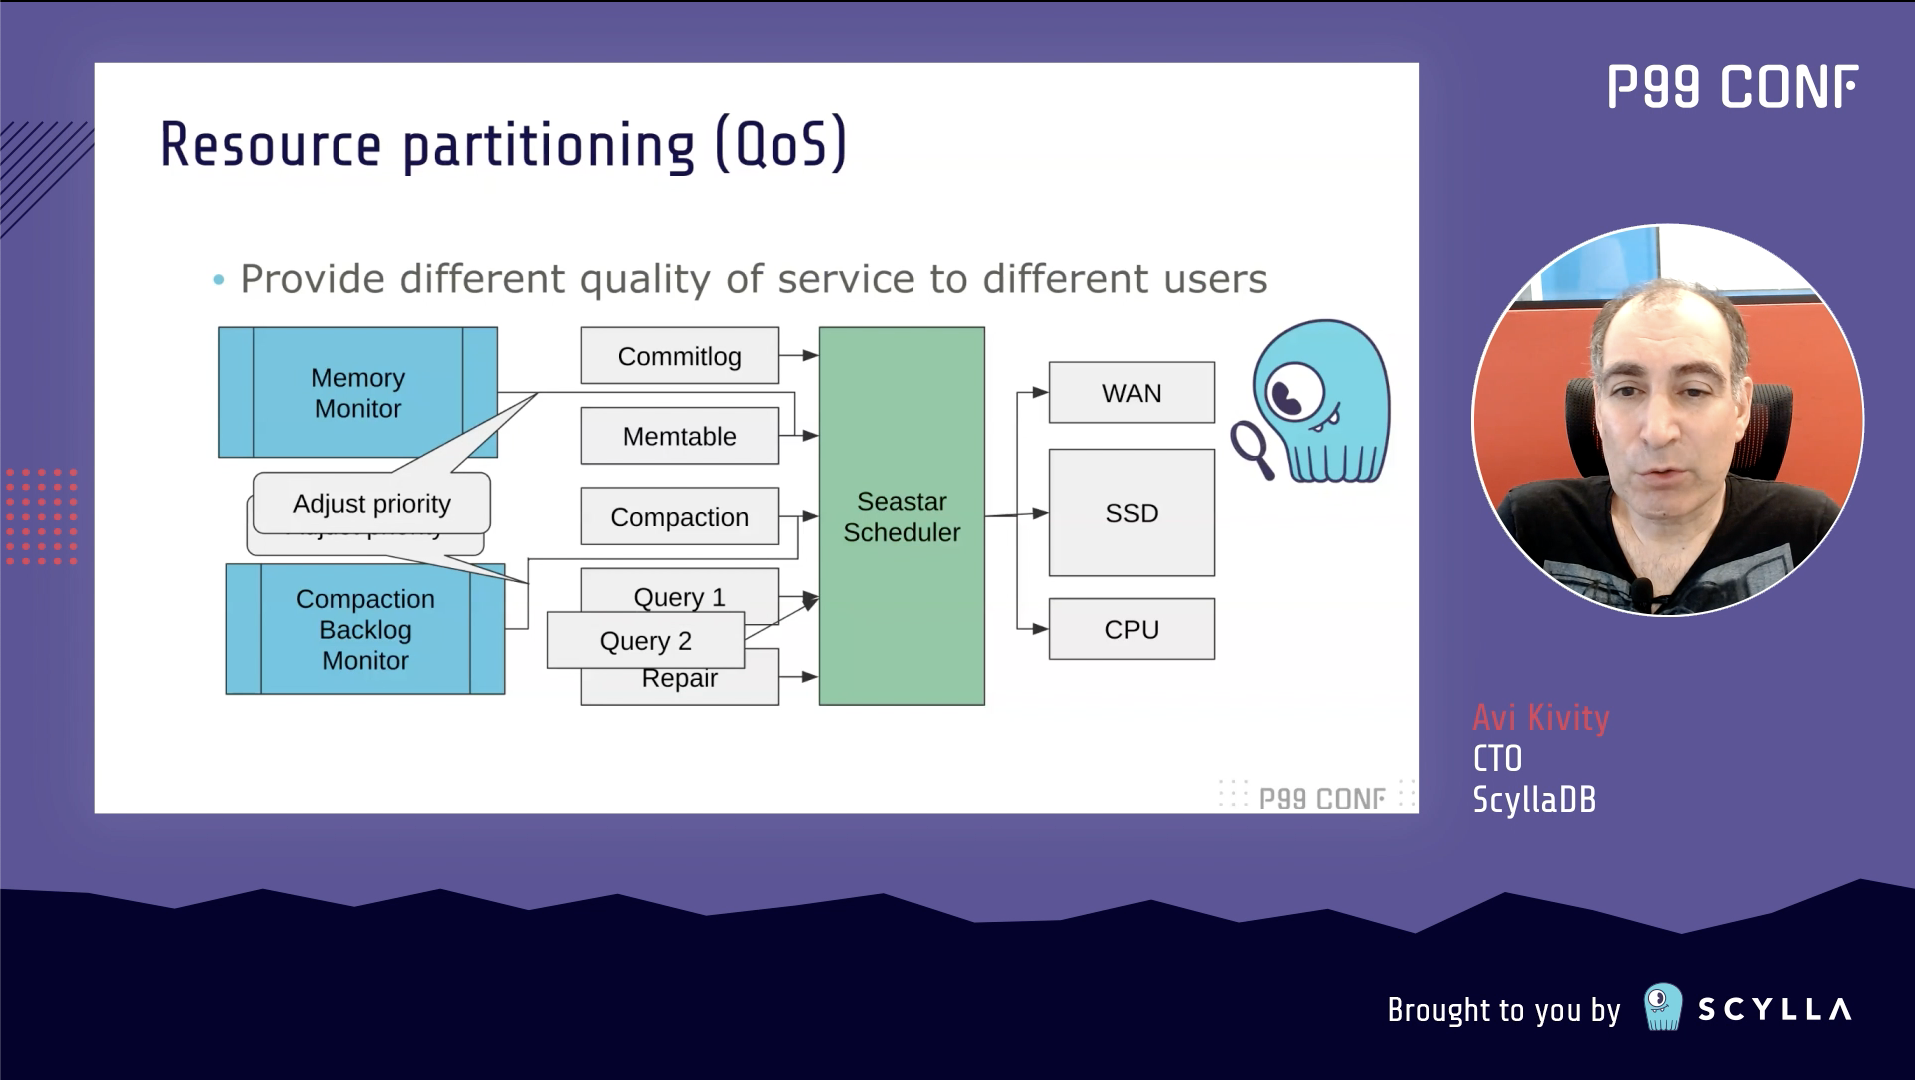
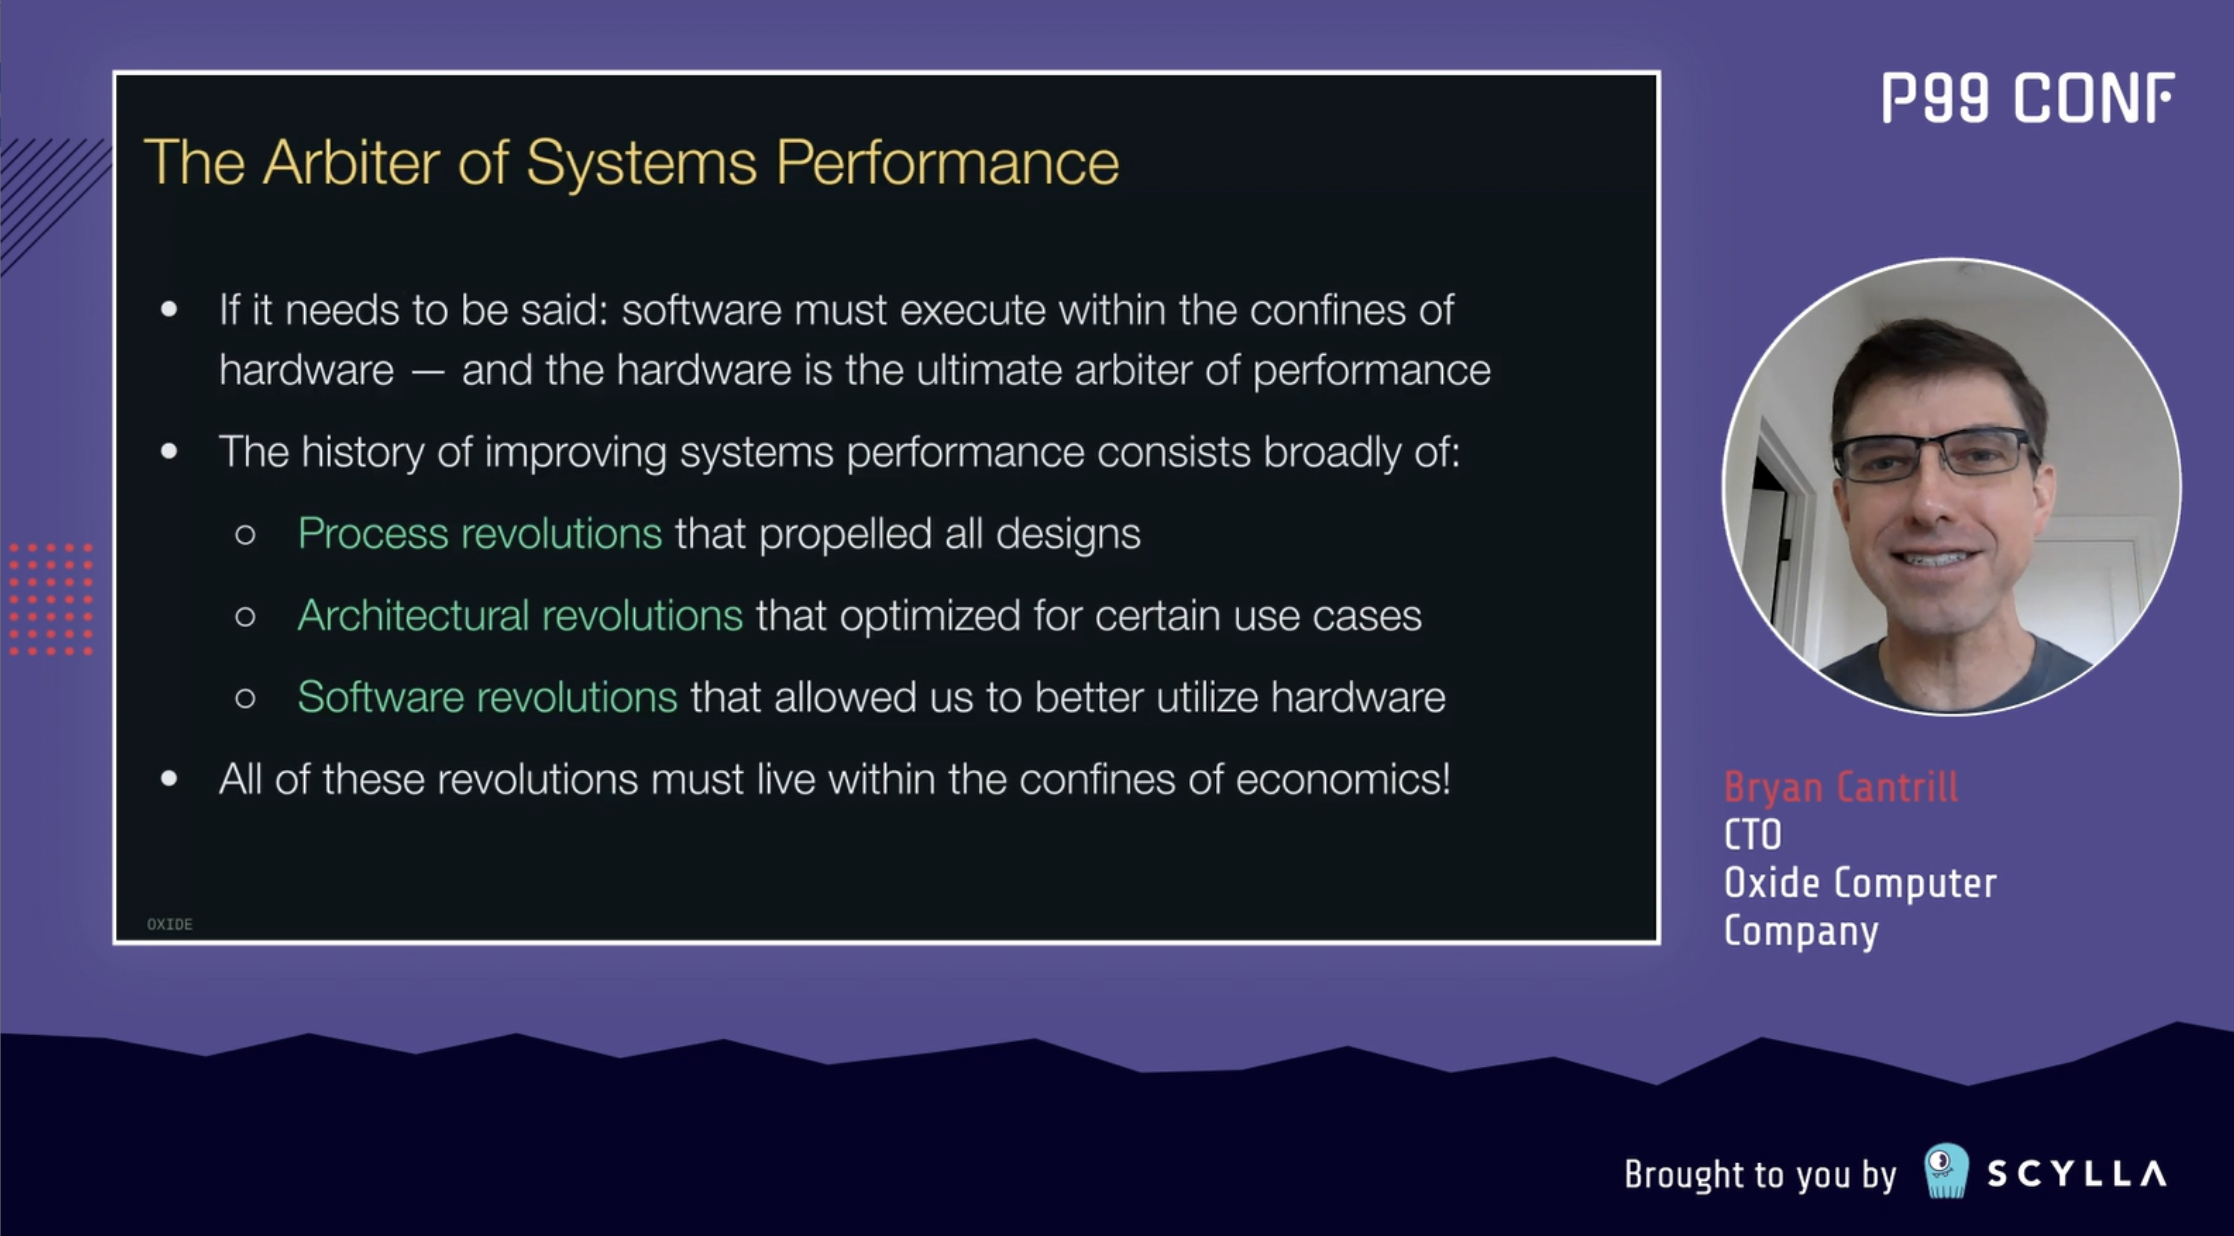
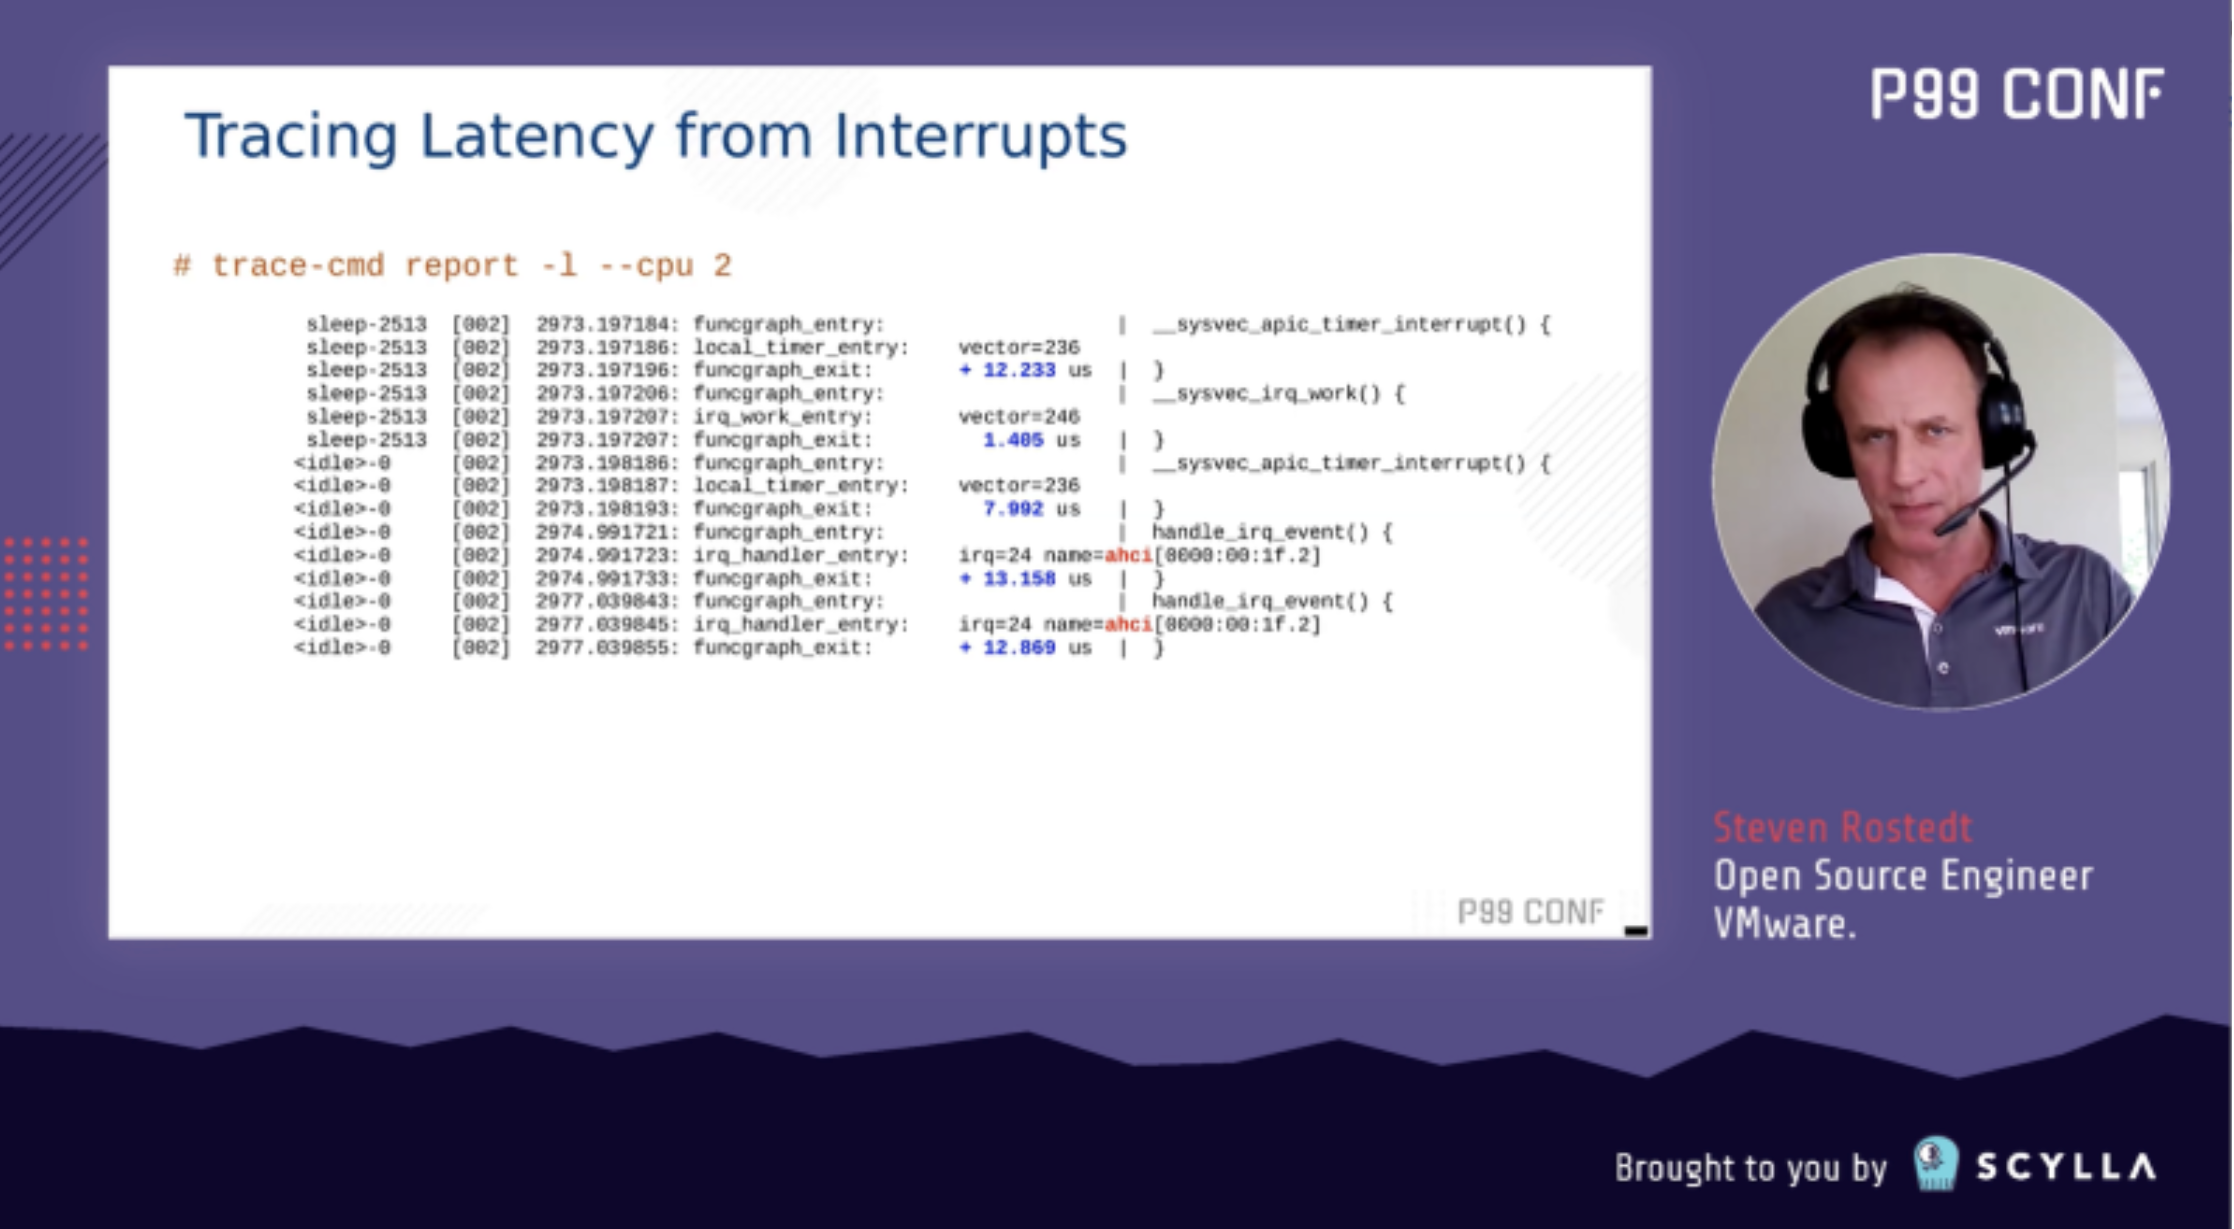
Sign Up for P99 CONF
If you enjoyed this digital sleuthing to find a single bug, you are going to love the sorts of detective stories that will be shared at P99 CONF, a free online conference this October 6th and 7th, 2021. P99 CONF is dedicated to developers who care about P99 percentiles and high-performance, low-latency applications. You can hear talks by experts drawn from across the cloud computing industry — developers, senior engineers, software architects and open source committers working on industry-leading projects. You can register for the event now at p99conf.io.
REGISTER FOR P99 CONF
The post Hunting a NUMA Performance Bug appeared first on ScyllaDB.


 )
)