![]()
This is part two of a two-part blog series on the relative performance of the recently released Apache Cassandra 4.0. In part one, we compared Cassandra 4.0’s improvements over Cassandra 3.11. In part two we will compare Cassandra 4.0 and 3.11 with the performance of Scylla Open Source 4.4.
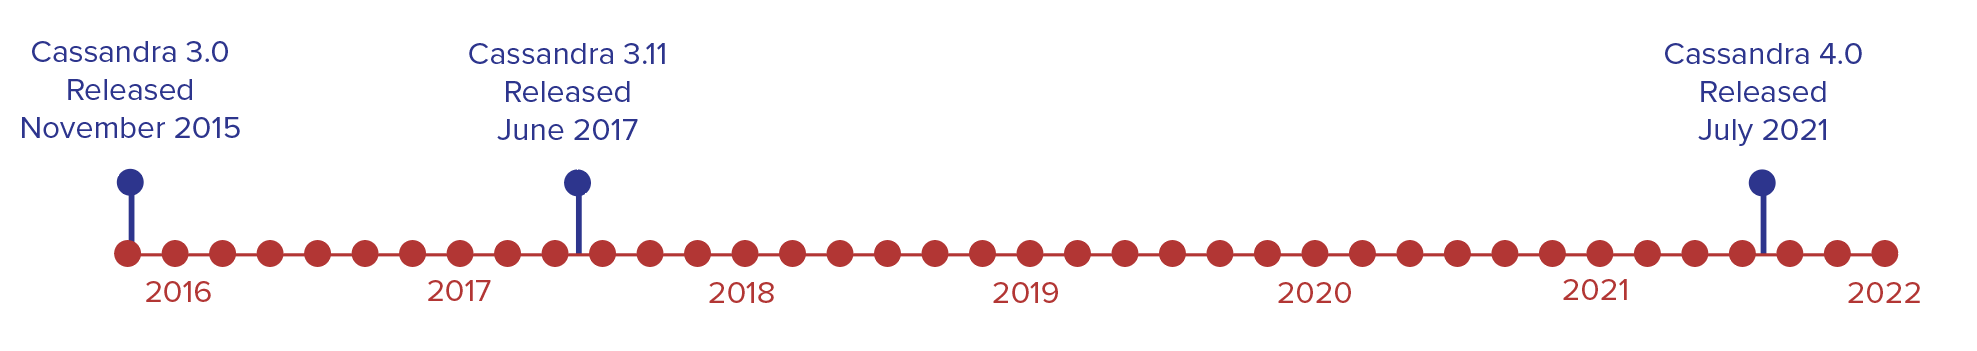
On July 27, 2021, after almost six years of work, the engineers behind Apache Cassandra bumped its major revision number from 3 to 4. Over almost the same period of time, Scylla emerged from its earliest beta (October 2015), proceeded through four major releases, and is currently at minor release 4.4.
![]()
In the fast-paced world of big data many other advances have occurred: there are new JVMs, new system kernels, new hardware, new libraries and even new algorithms. Progress in all those areas presented Cassandra with some unprecedented opportunities to achieve new levels of performance. Similarly, Scylla did not stand still over this period, as we consistently improved our NoSQL database engine with new features and optimizations.
Let’s compare the performance of the latest release of Scylla Open Source 4.4 against Cassandra 4.0 and Cassandra 3.11. We measured the latencies and throughputs at different loads, as well as the speed of common administrative operations like adding/replacing a node or running major compactions.
TL;DR Scylla Open Source 4.4 vs. Cassandra 4.0 Results
The detailed results and the fully optimized setup instructions are shared below. We compared two deployment options in the AWS EC2 environment:
- The first is an apples-to-apples comparison of 3-node clusters.
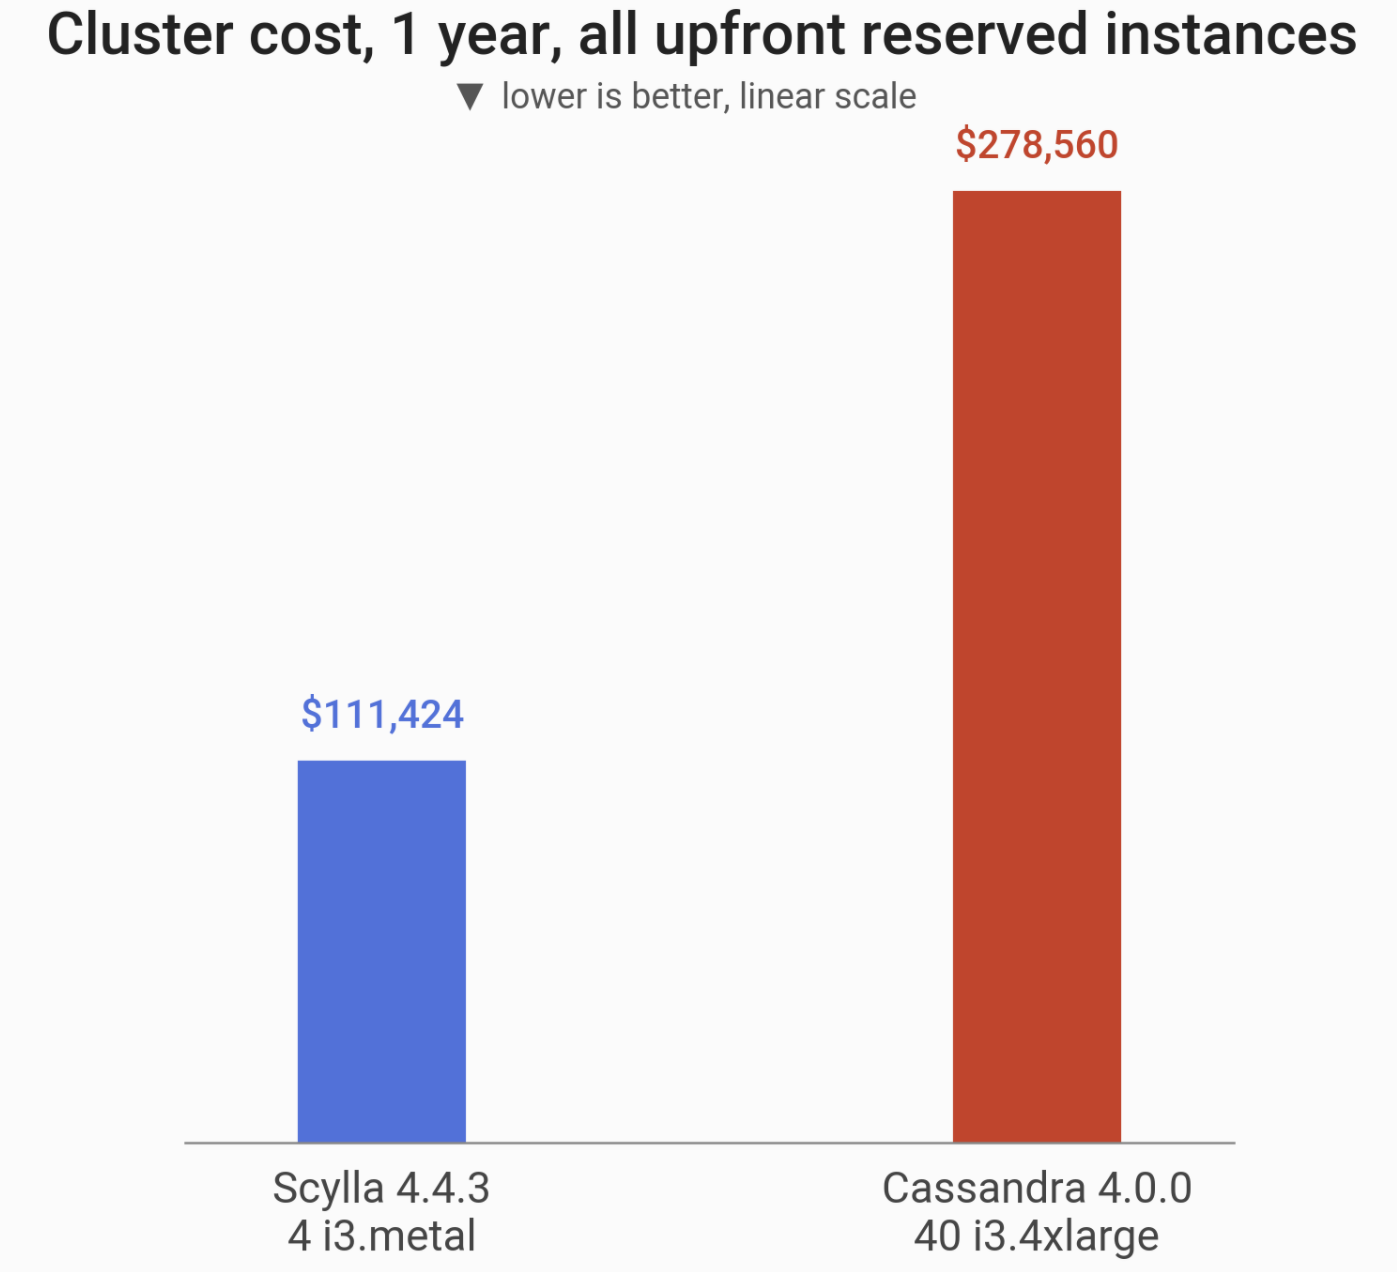
- The second is a larger-scale setup where we used node sizes optimal for each database. Scylla can utilize very large nodes so we compared a setup of 4 i3.metal machines (288 vCPUs in total) vs. 40 (!) i3.4xlarge Cassandra machines (640 vCPUs in total — almost 2.5x the Scylla’s resources).
Key findings:
- Cassandra 4.0 has better P99 latency than Cassandra 3.11 by 100x!
- Cassandra 4.0 speeds up admin operations by up to 34% compared to Cassandra 3.11
- Scylla has 2x-5x better throughput than Cassandra 4.0 on the same 3-node cluster
- Scylla has 3x-8x better throughput than Cassandra 4.0 on the same 3-node cluster while P99 <10ms
- Scylla adds a node 3x faster than Cassandra 4.0
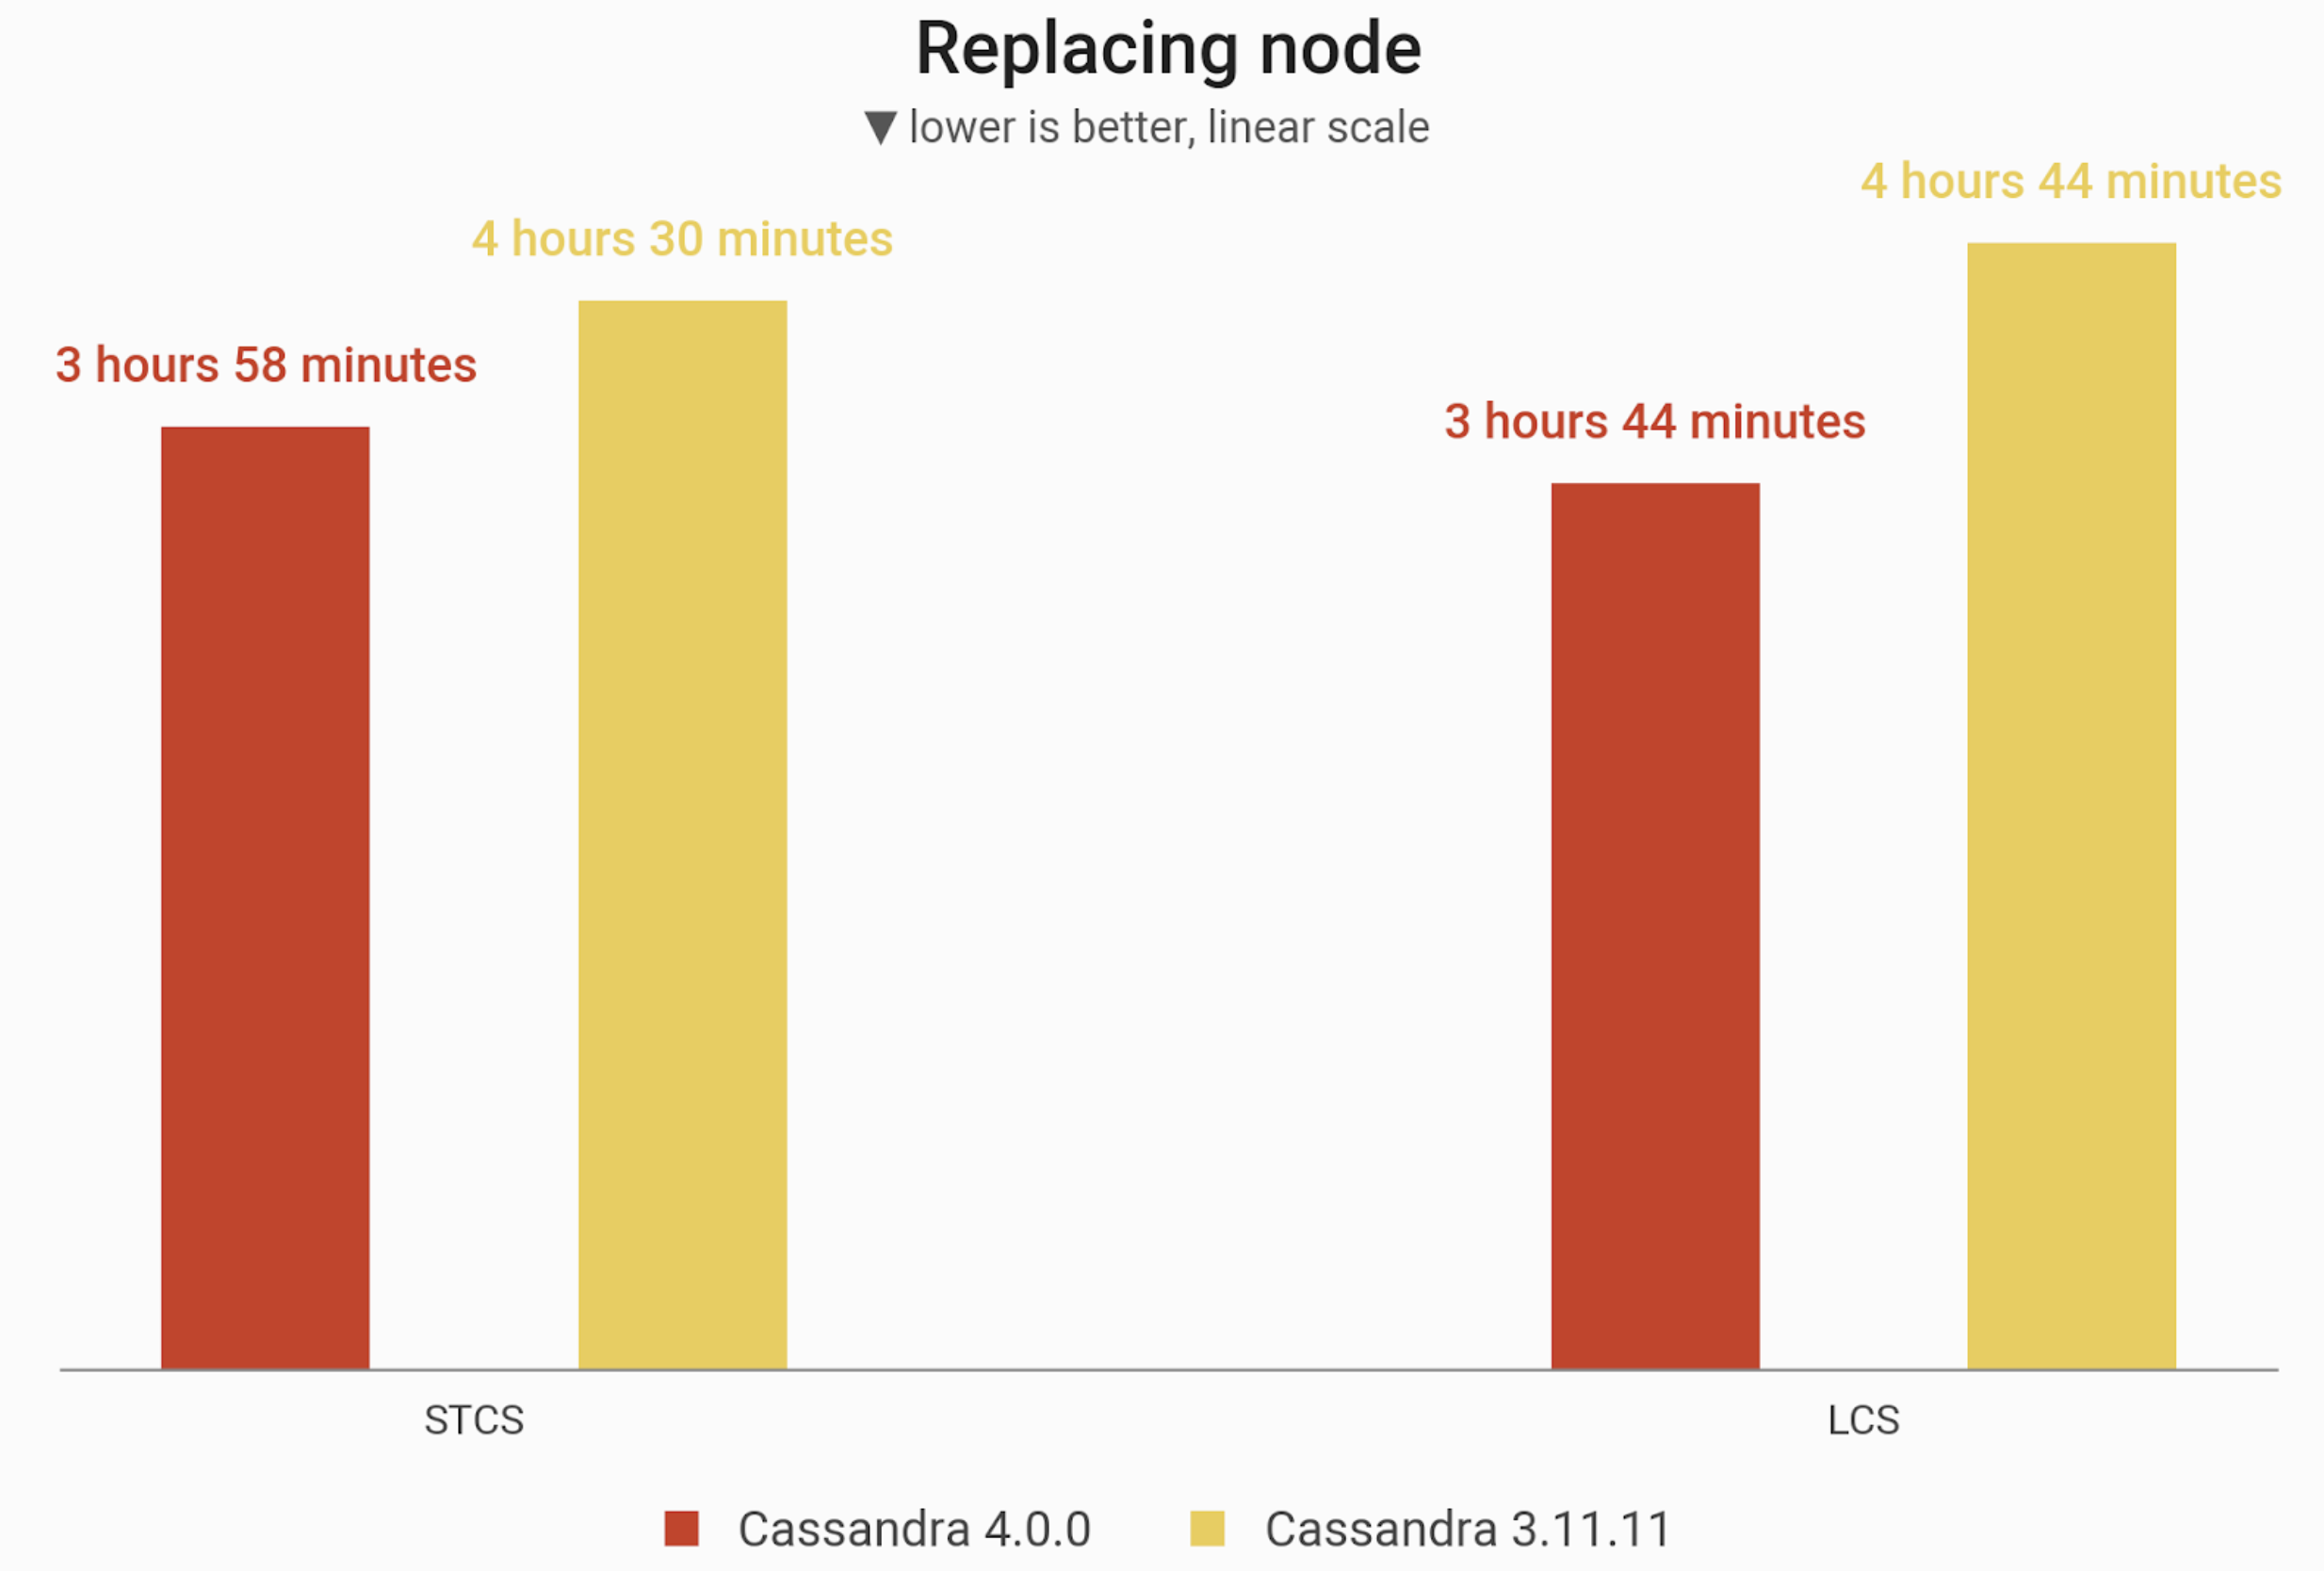
- Scylla replaces a node 4x faster than Cassandra 4.0
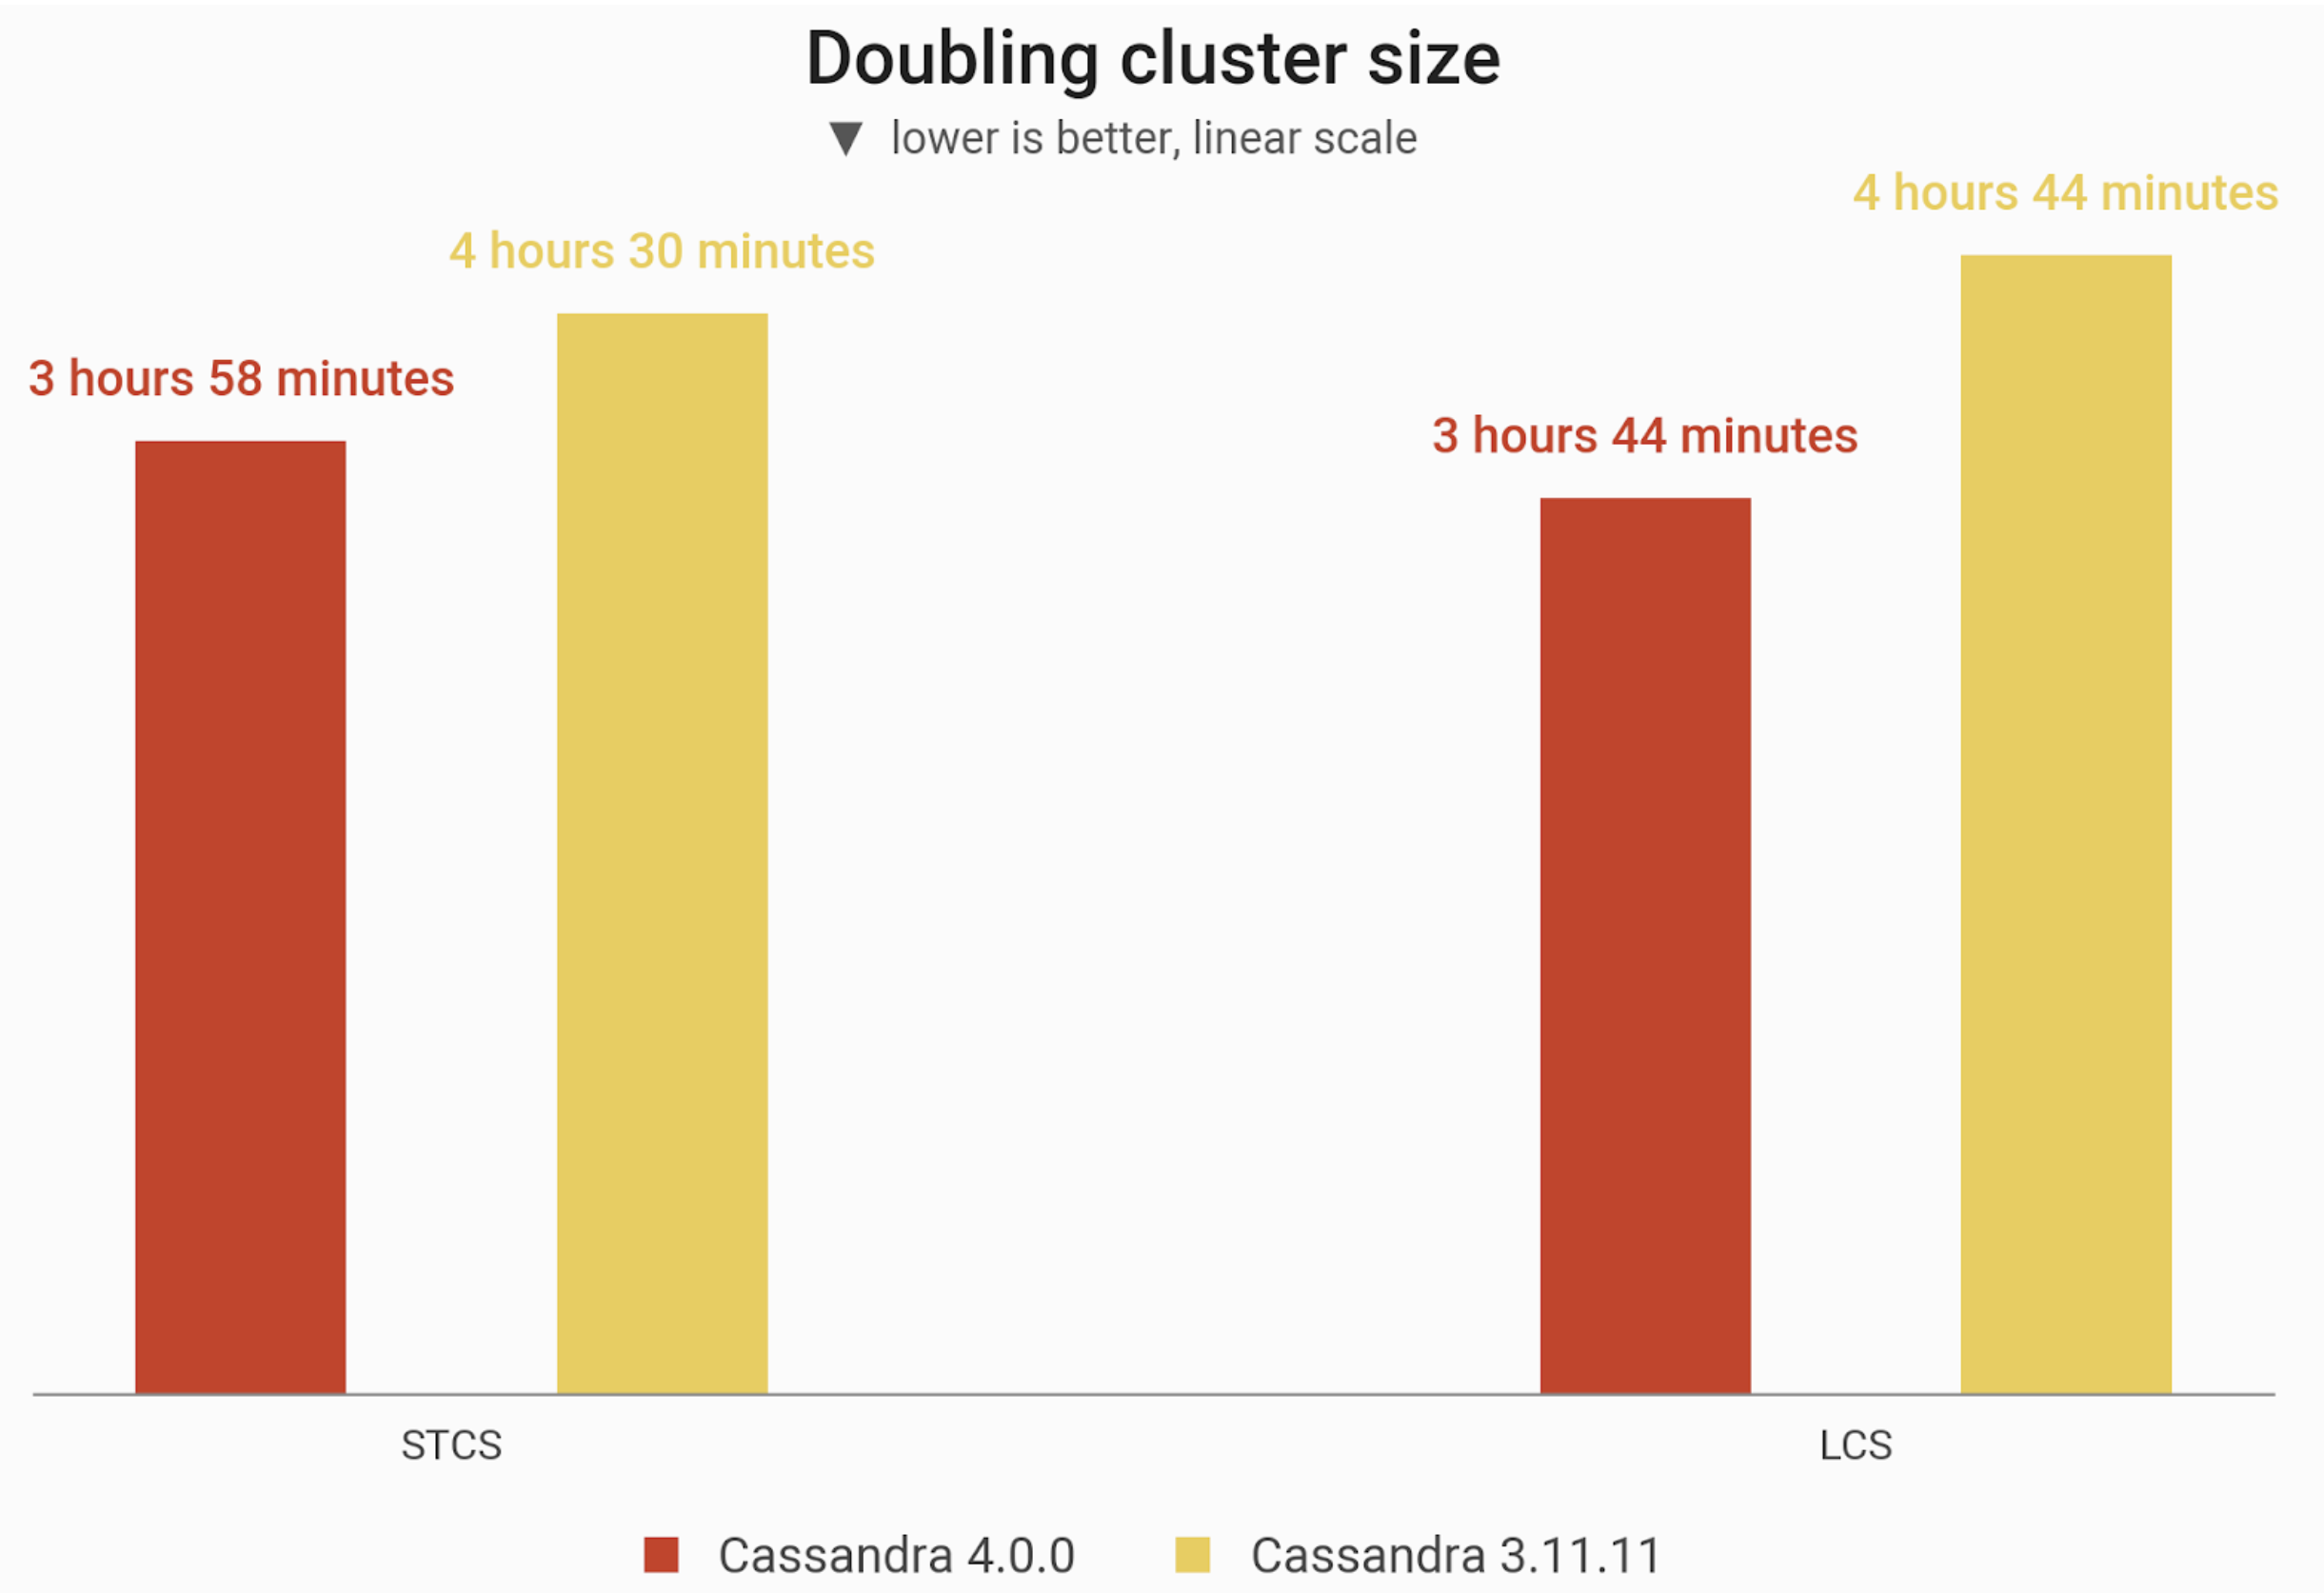
- Scylla doubles a 3-node cluster capacity 2.5x faster than Cassandra 4.0
- A 40 TB cluster is 2.5x cheaper with Scylla while providing 42% more throughput under P99 latency of 10 ms
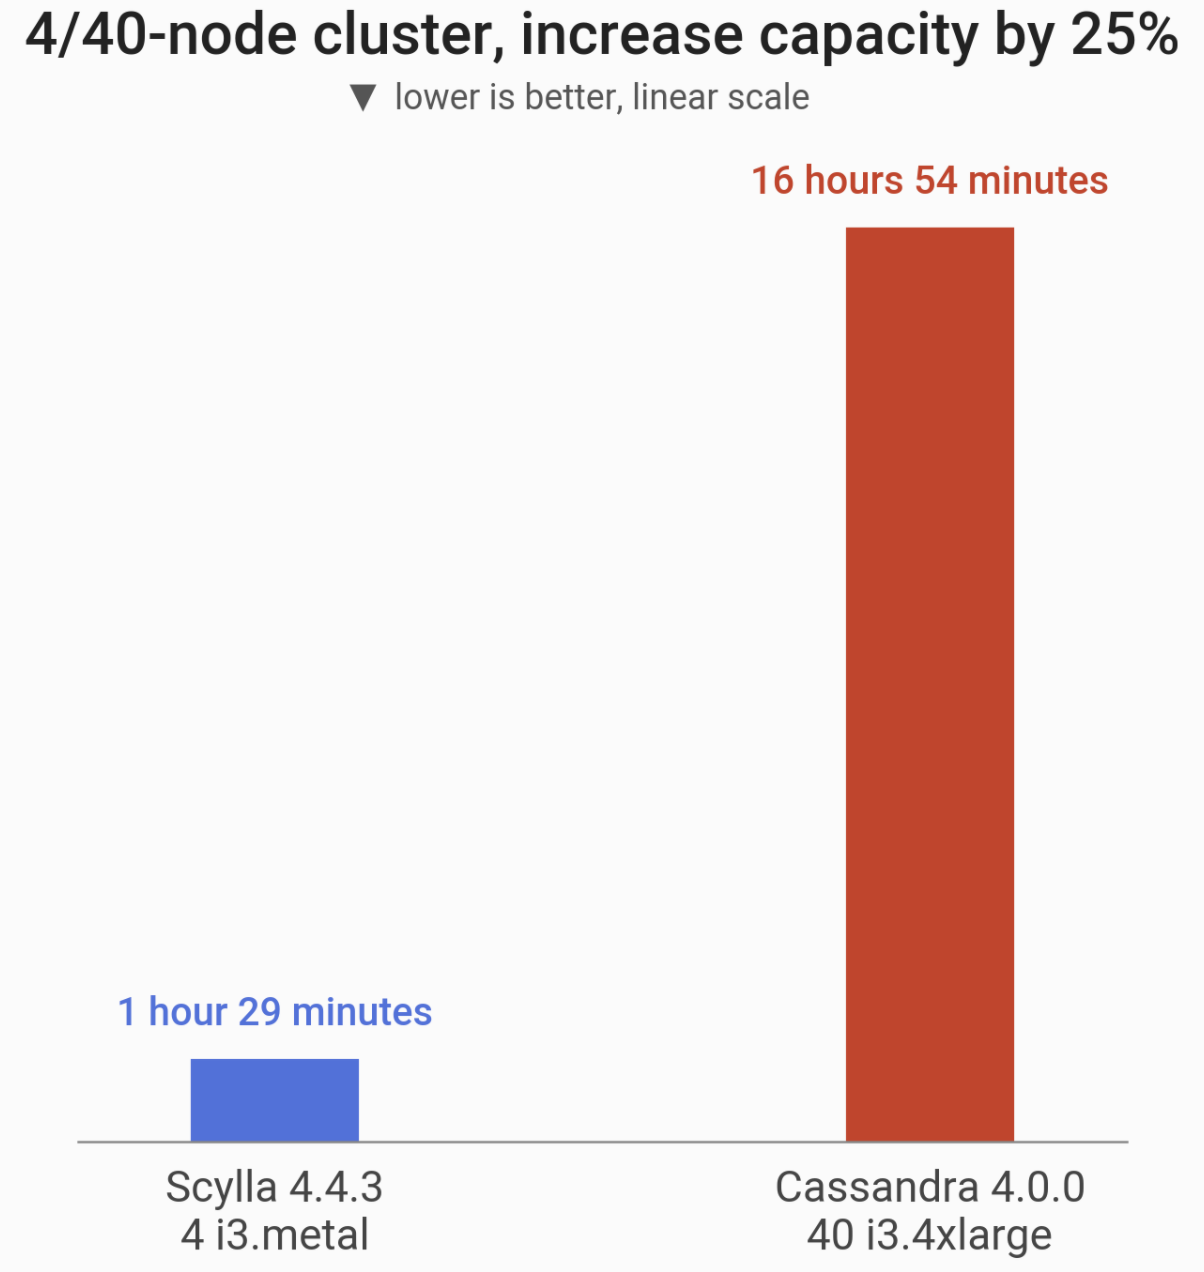
- Scylla adds 25% capacity to a 40 TB optimized cluster 11x faster than Cassandra 4.0.
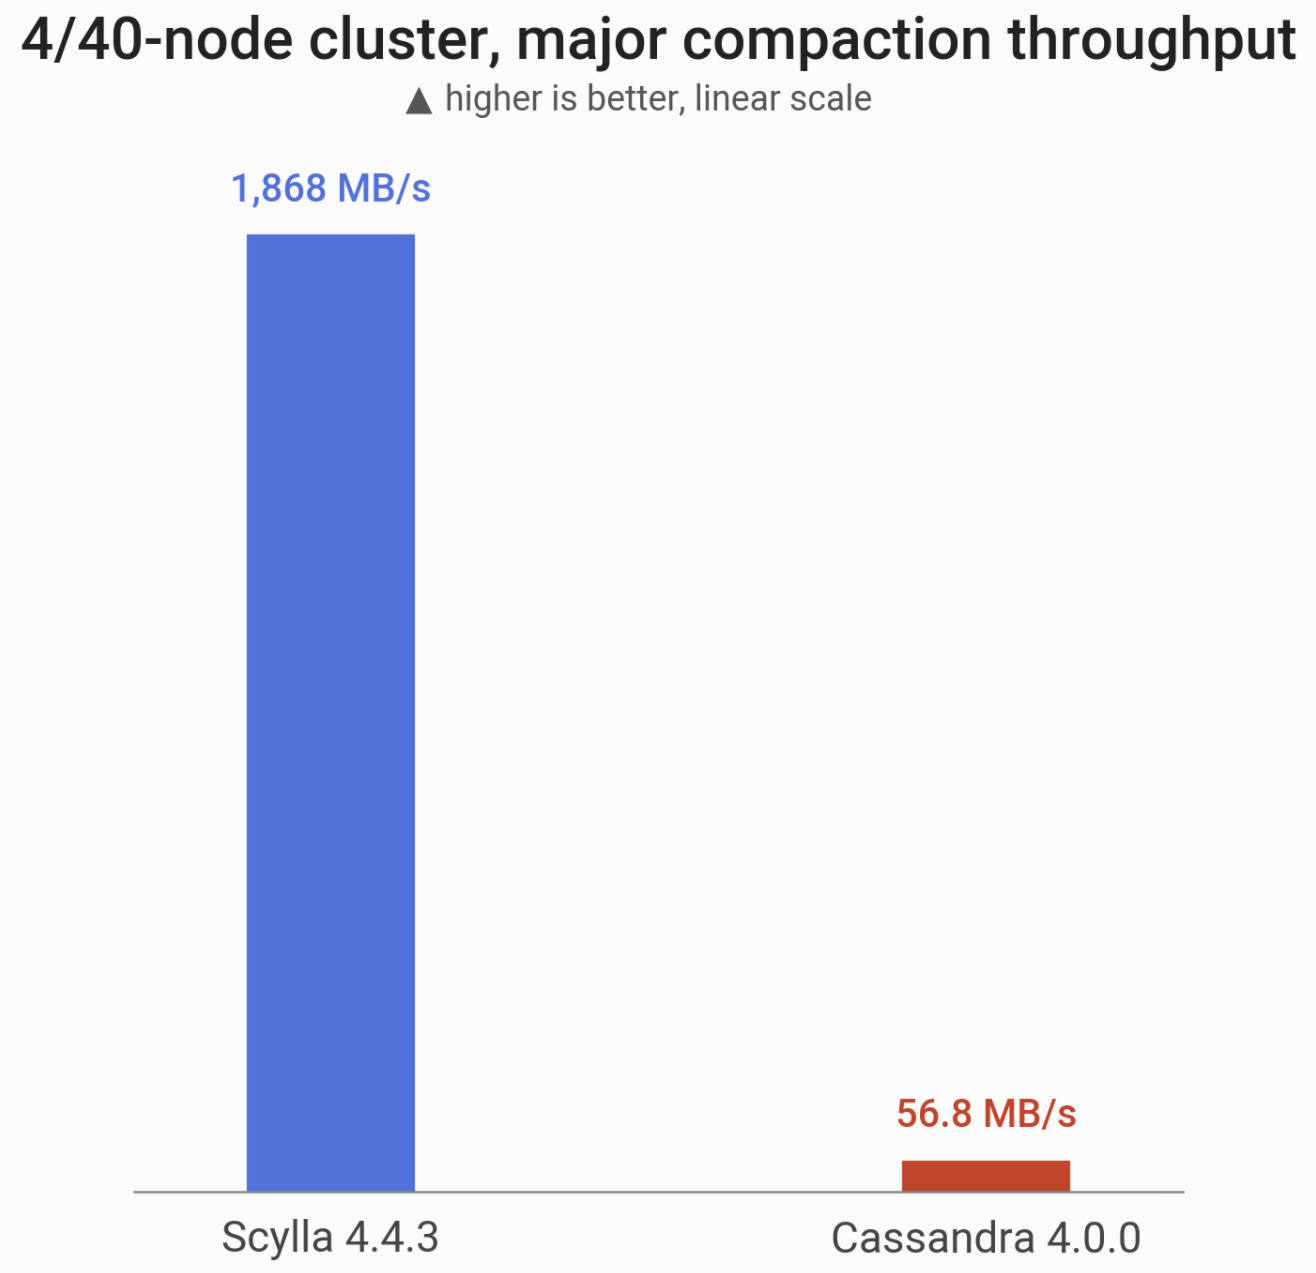
- Scylla finishes compaction 32x faster than Cassandra 4.0
- Cassandra 4.0 can achieve a better latency with 40 i3.4xlarge nodes than 4 i3.metal Scylla nodes when the throughput is low and the cluster is being underutilized. Explanation below.
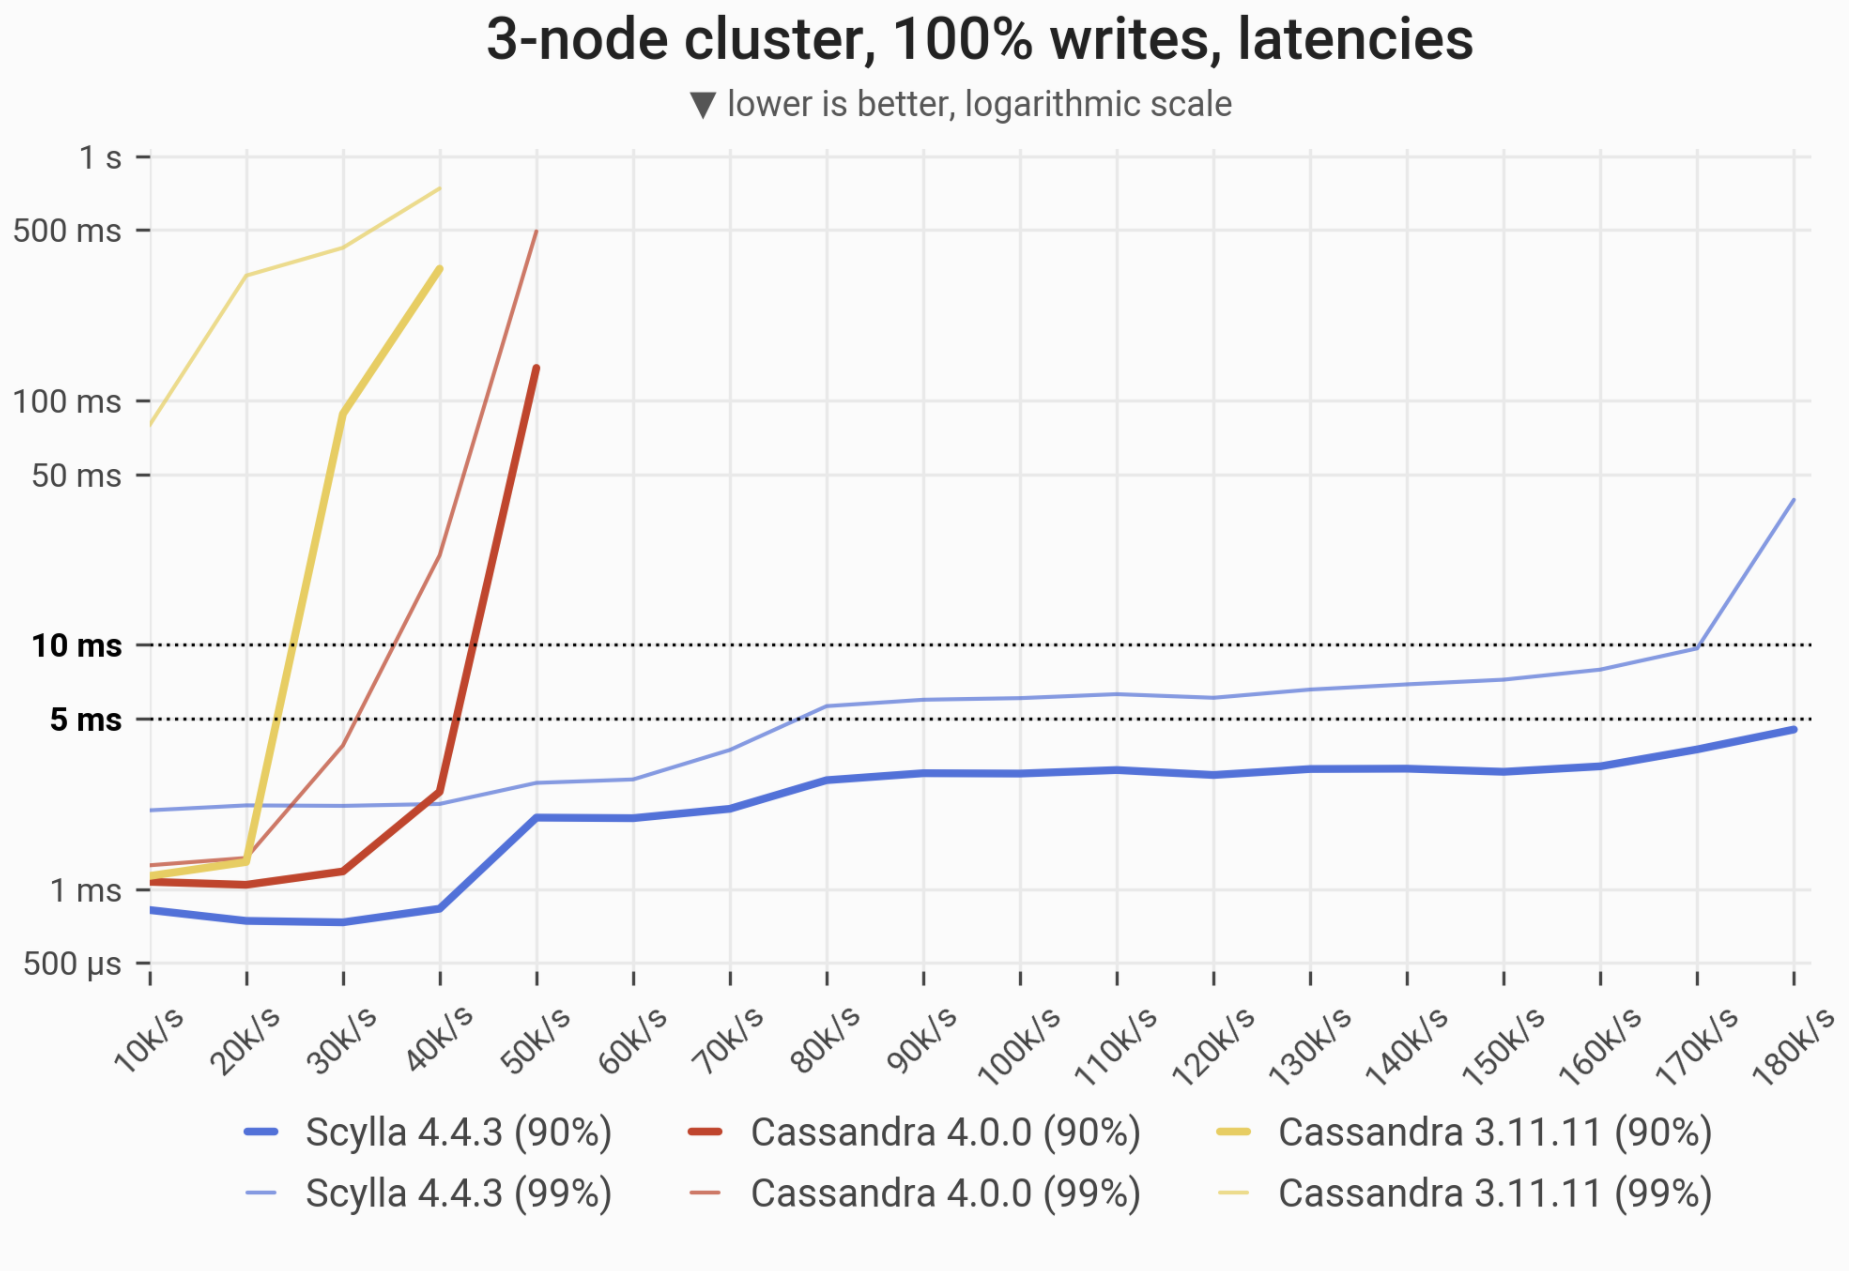
![]()
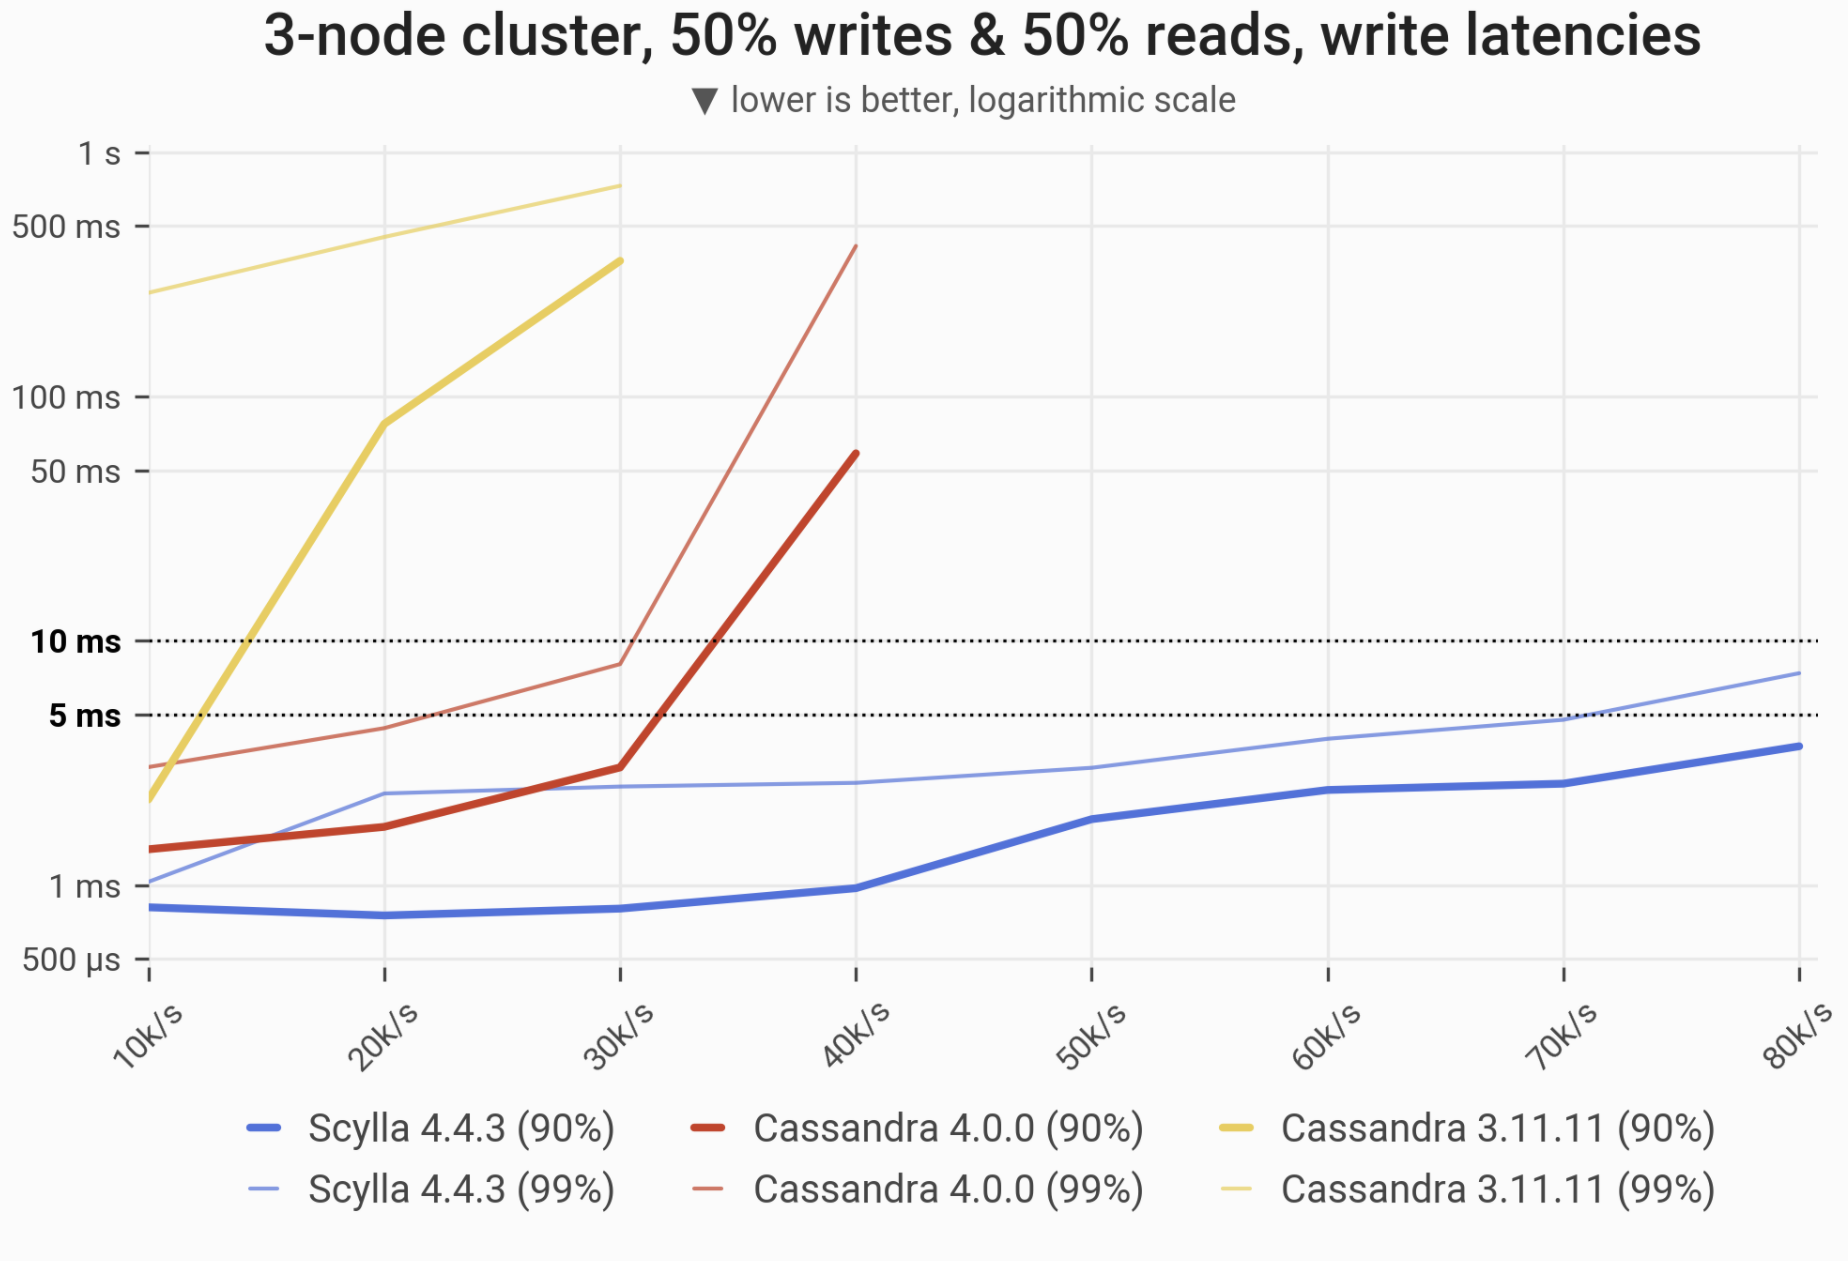
A peek into the results: the 90- and 99-percentile latencies of UPDATE queries, as measured on three i3.4xlarge machines (48 vCPUs in total) in a range of load rates. Both Cassandras quickly become functionally nonoperational, serving requests with tail latencies that exceed 1 second.
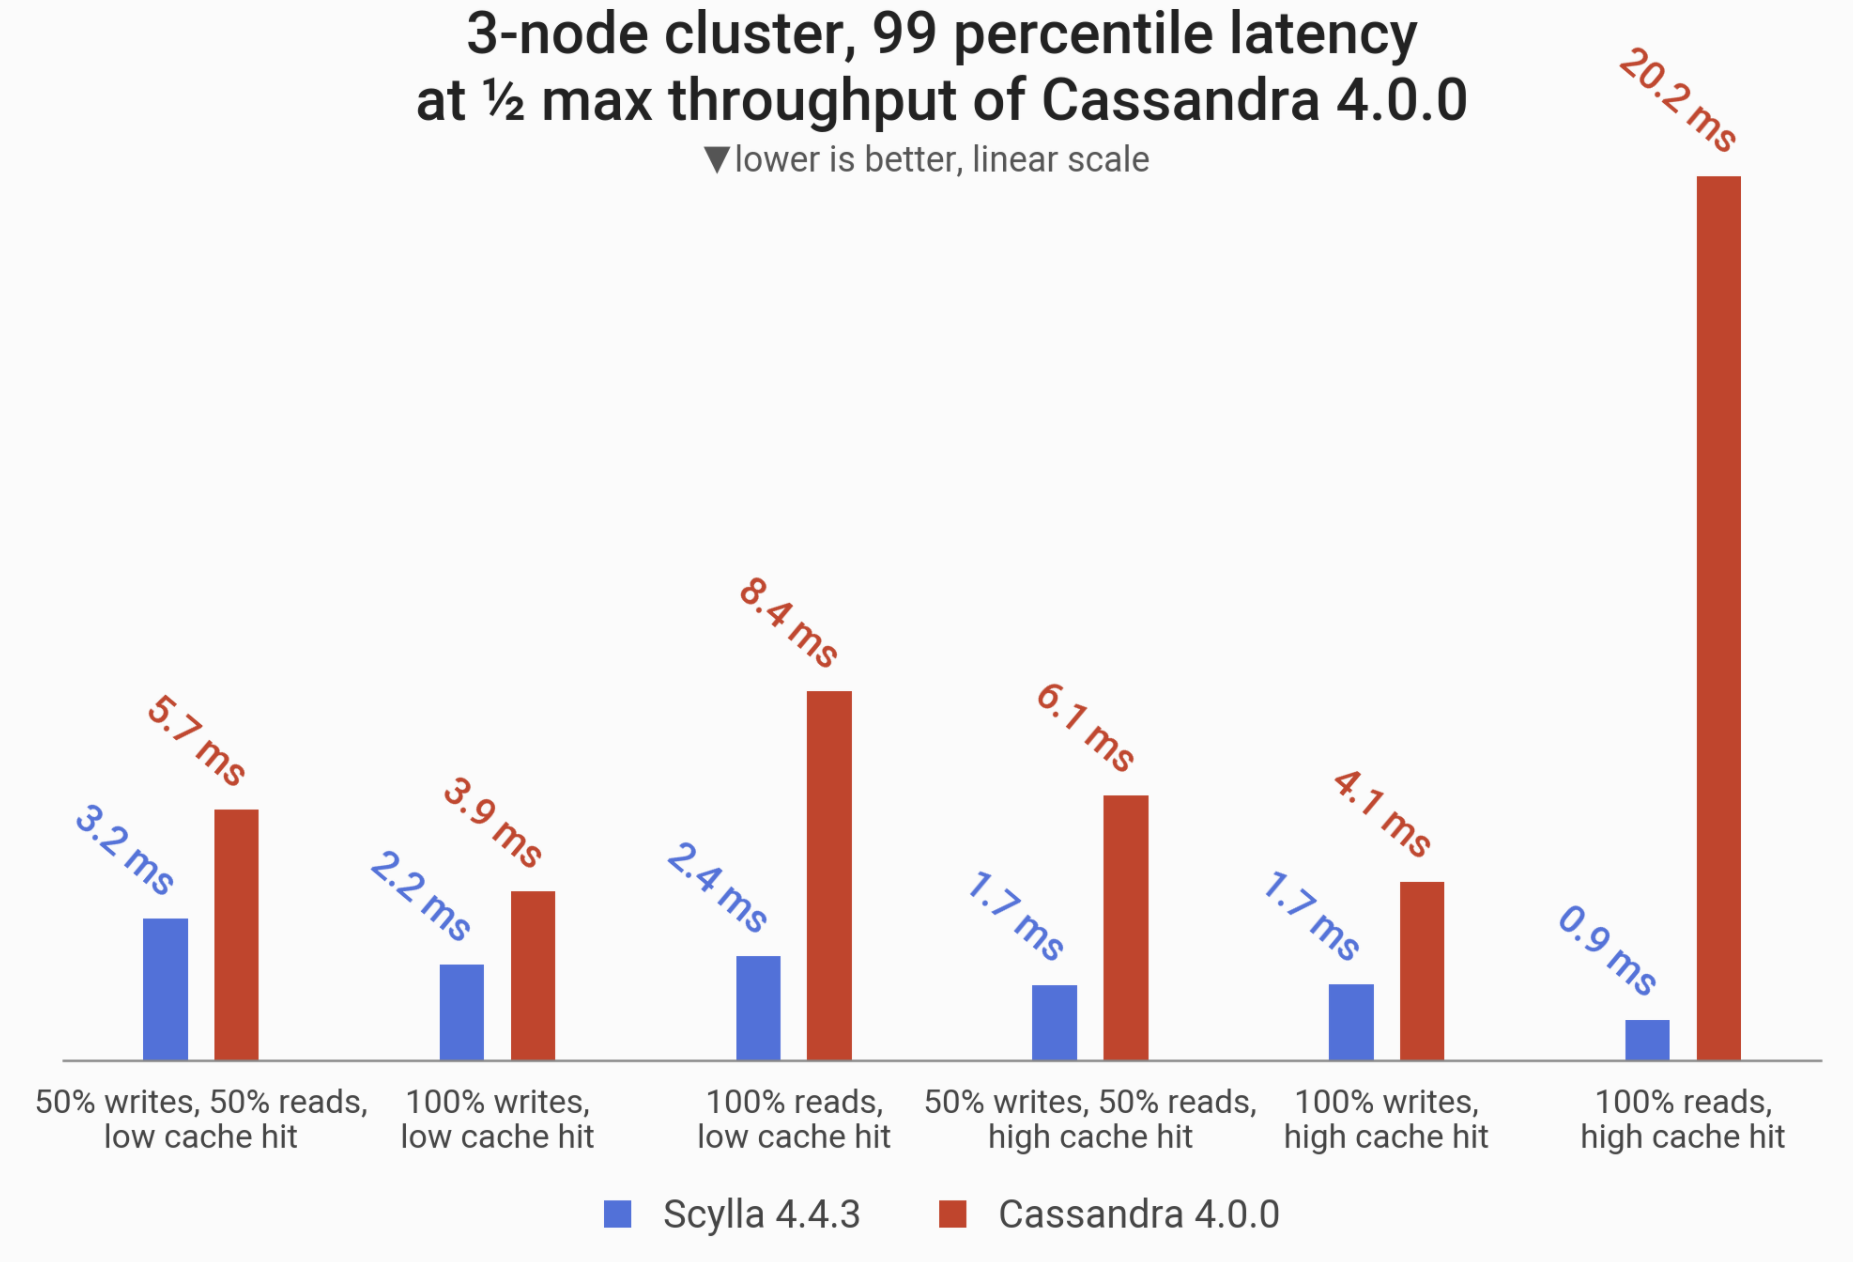
![]()
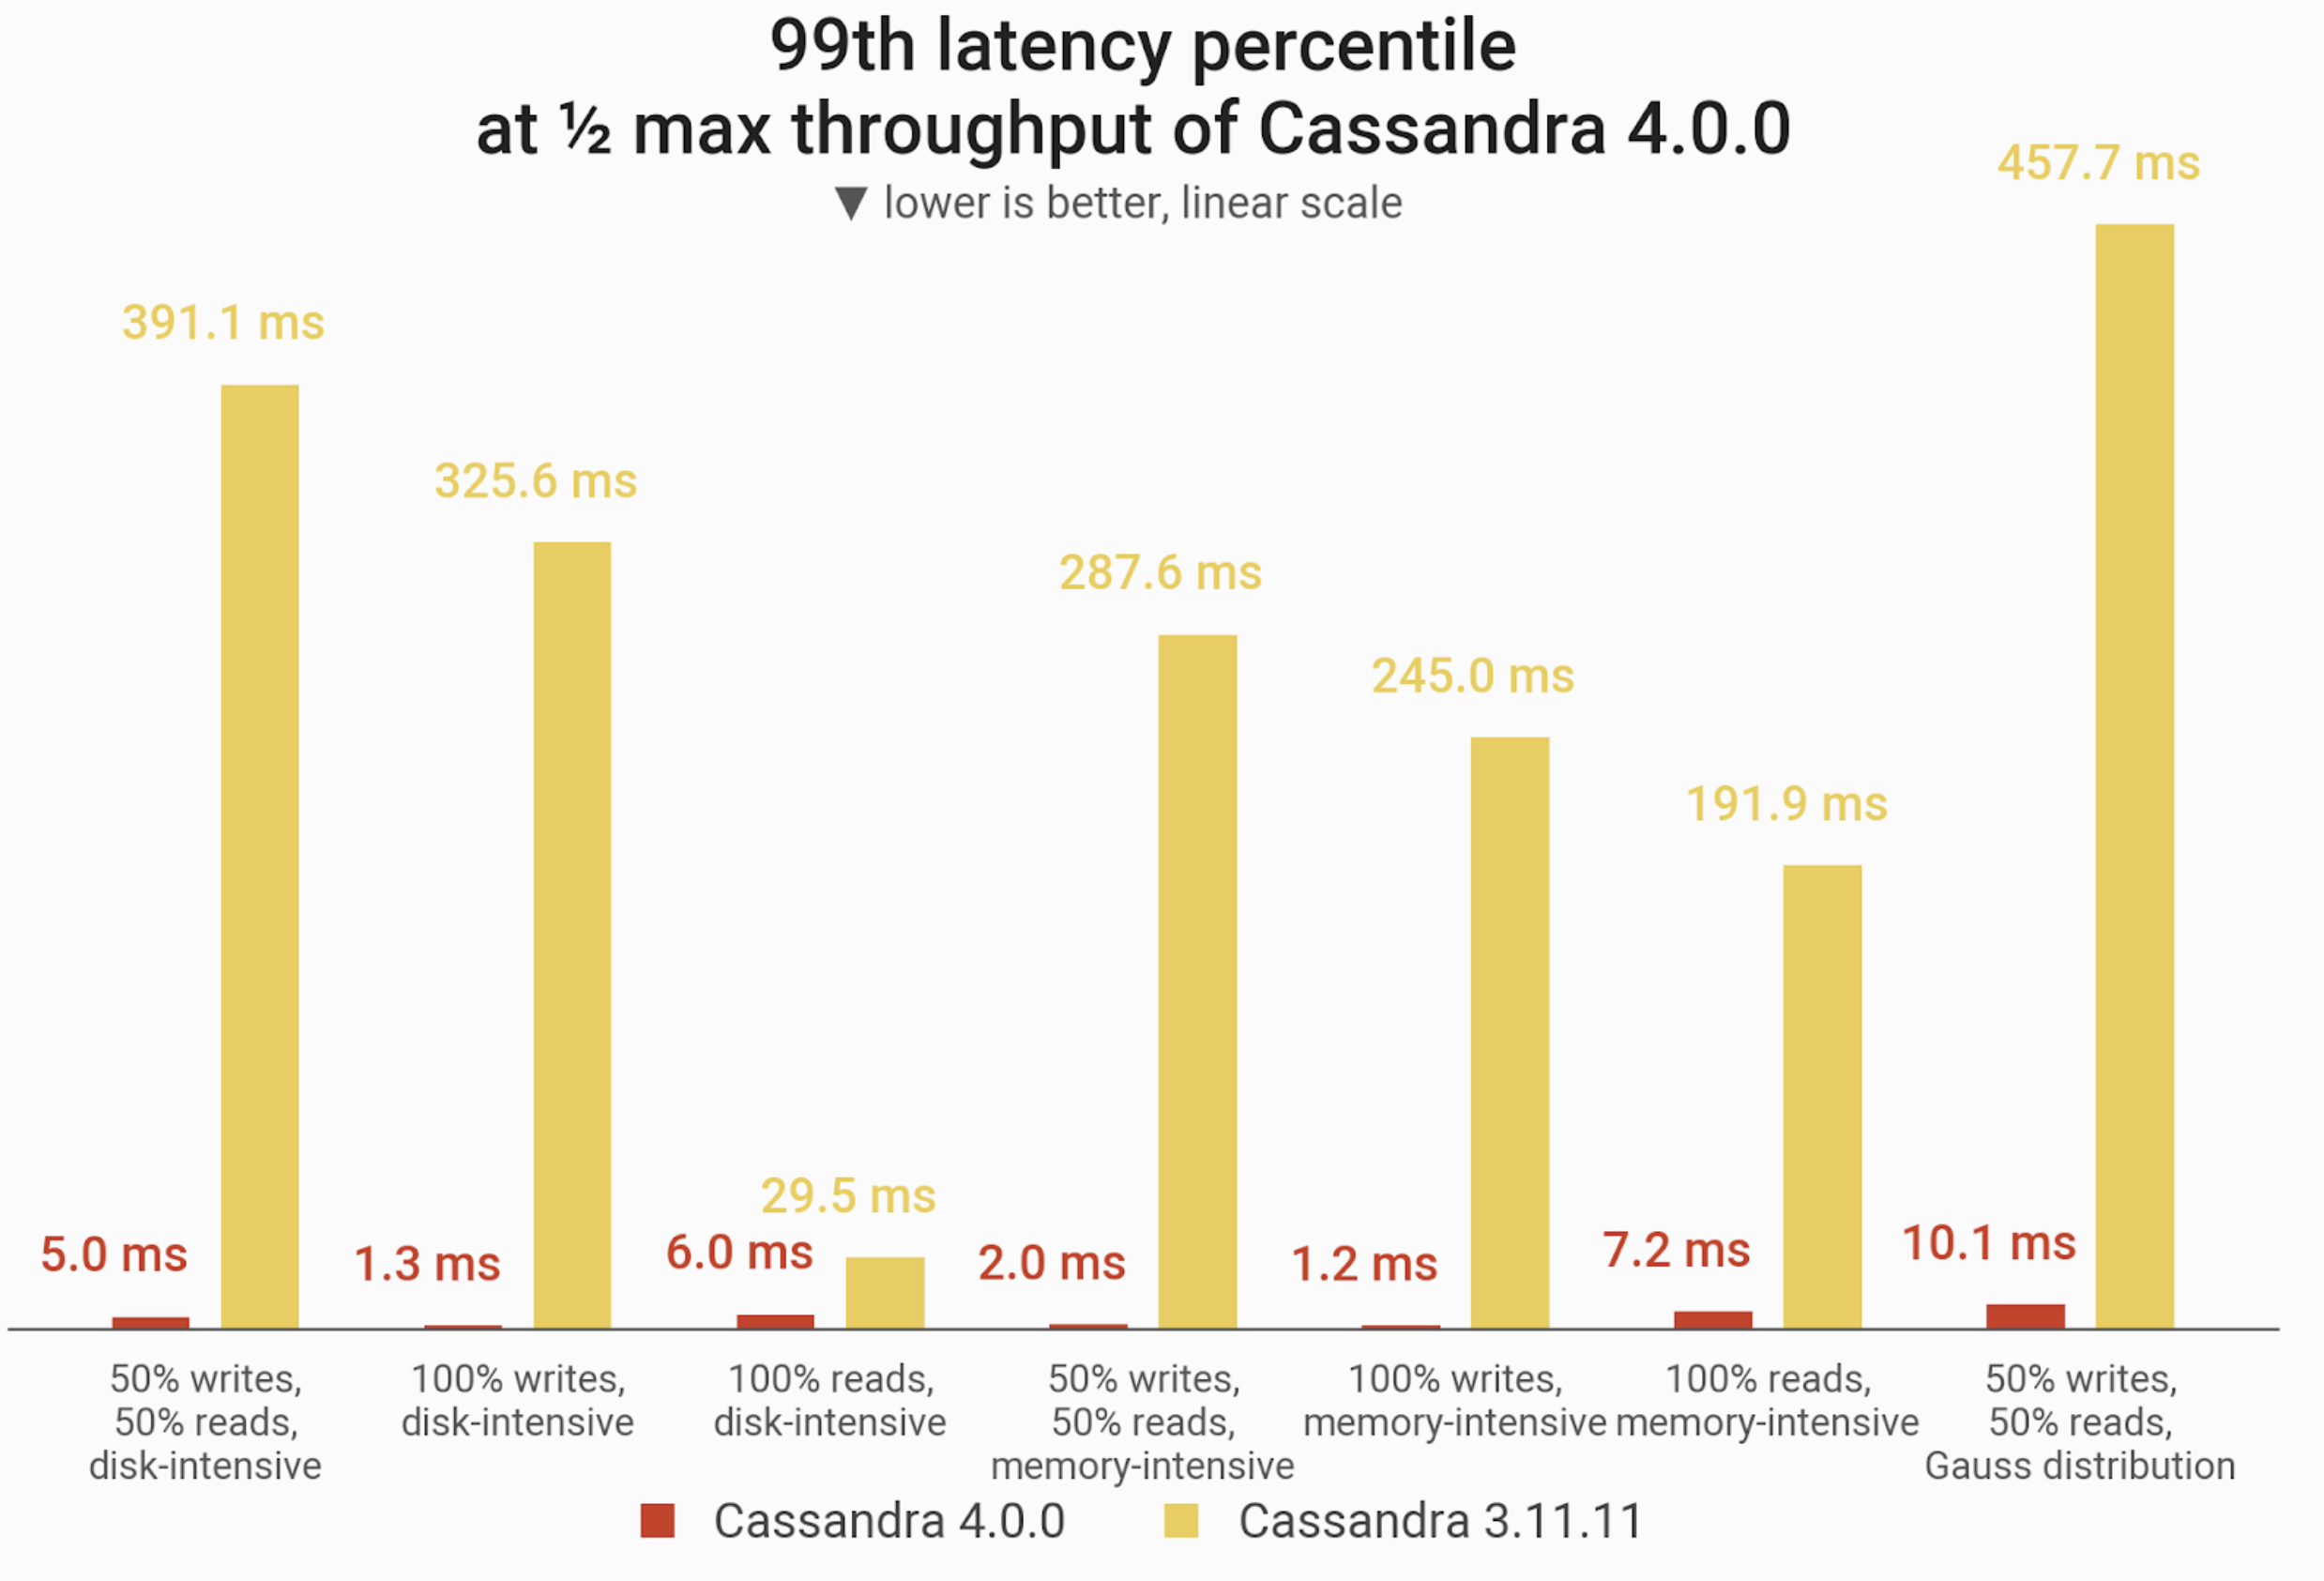
A peek into the results: the 99-percentile (P99) latencies in different scenarios, as measured on 3 x i3.4xlarge machines (48 vCPUs in total) under load that puts Cassandra 4.0 at halfway to saturation. Scylla excels at response times: Cassandra 4.0 P99 latencies are anywhere between 80% to 2,200% greater than Scylla 4.4.
![]()
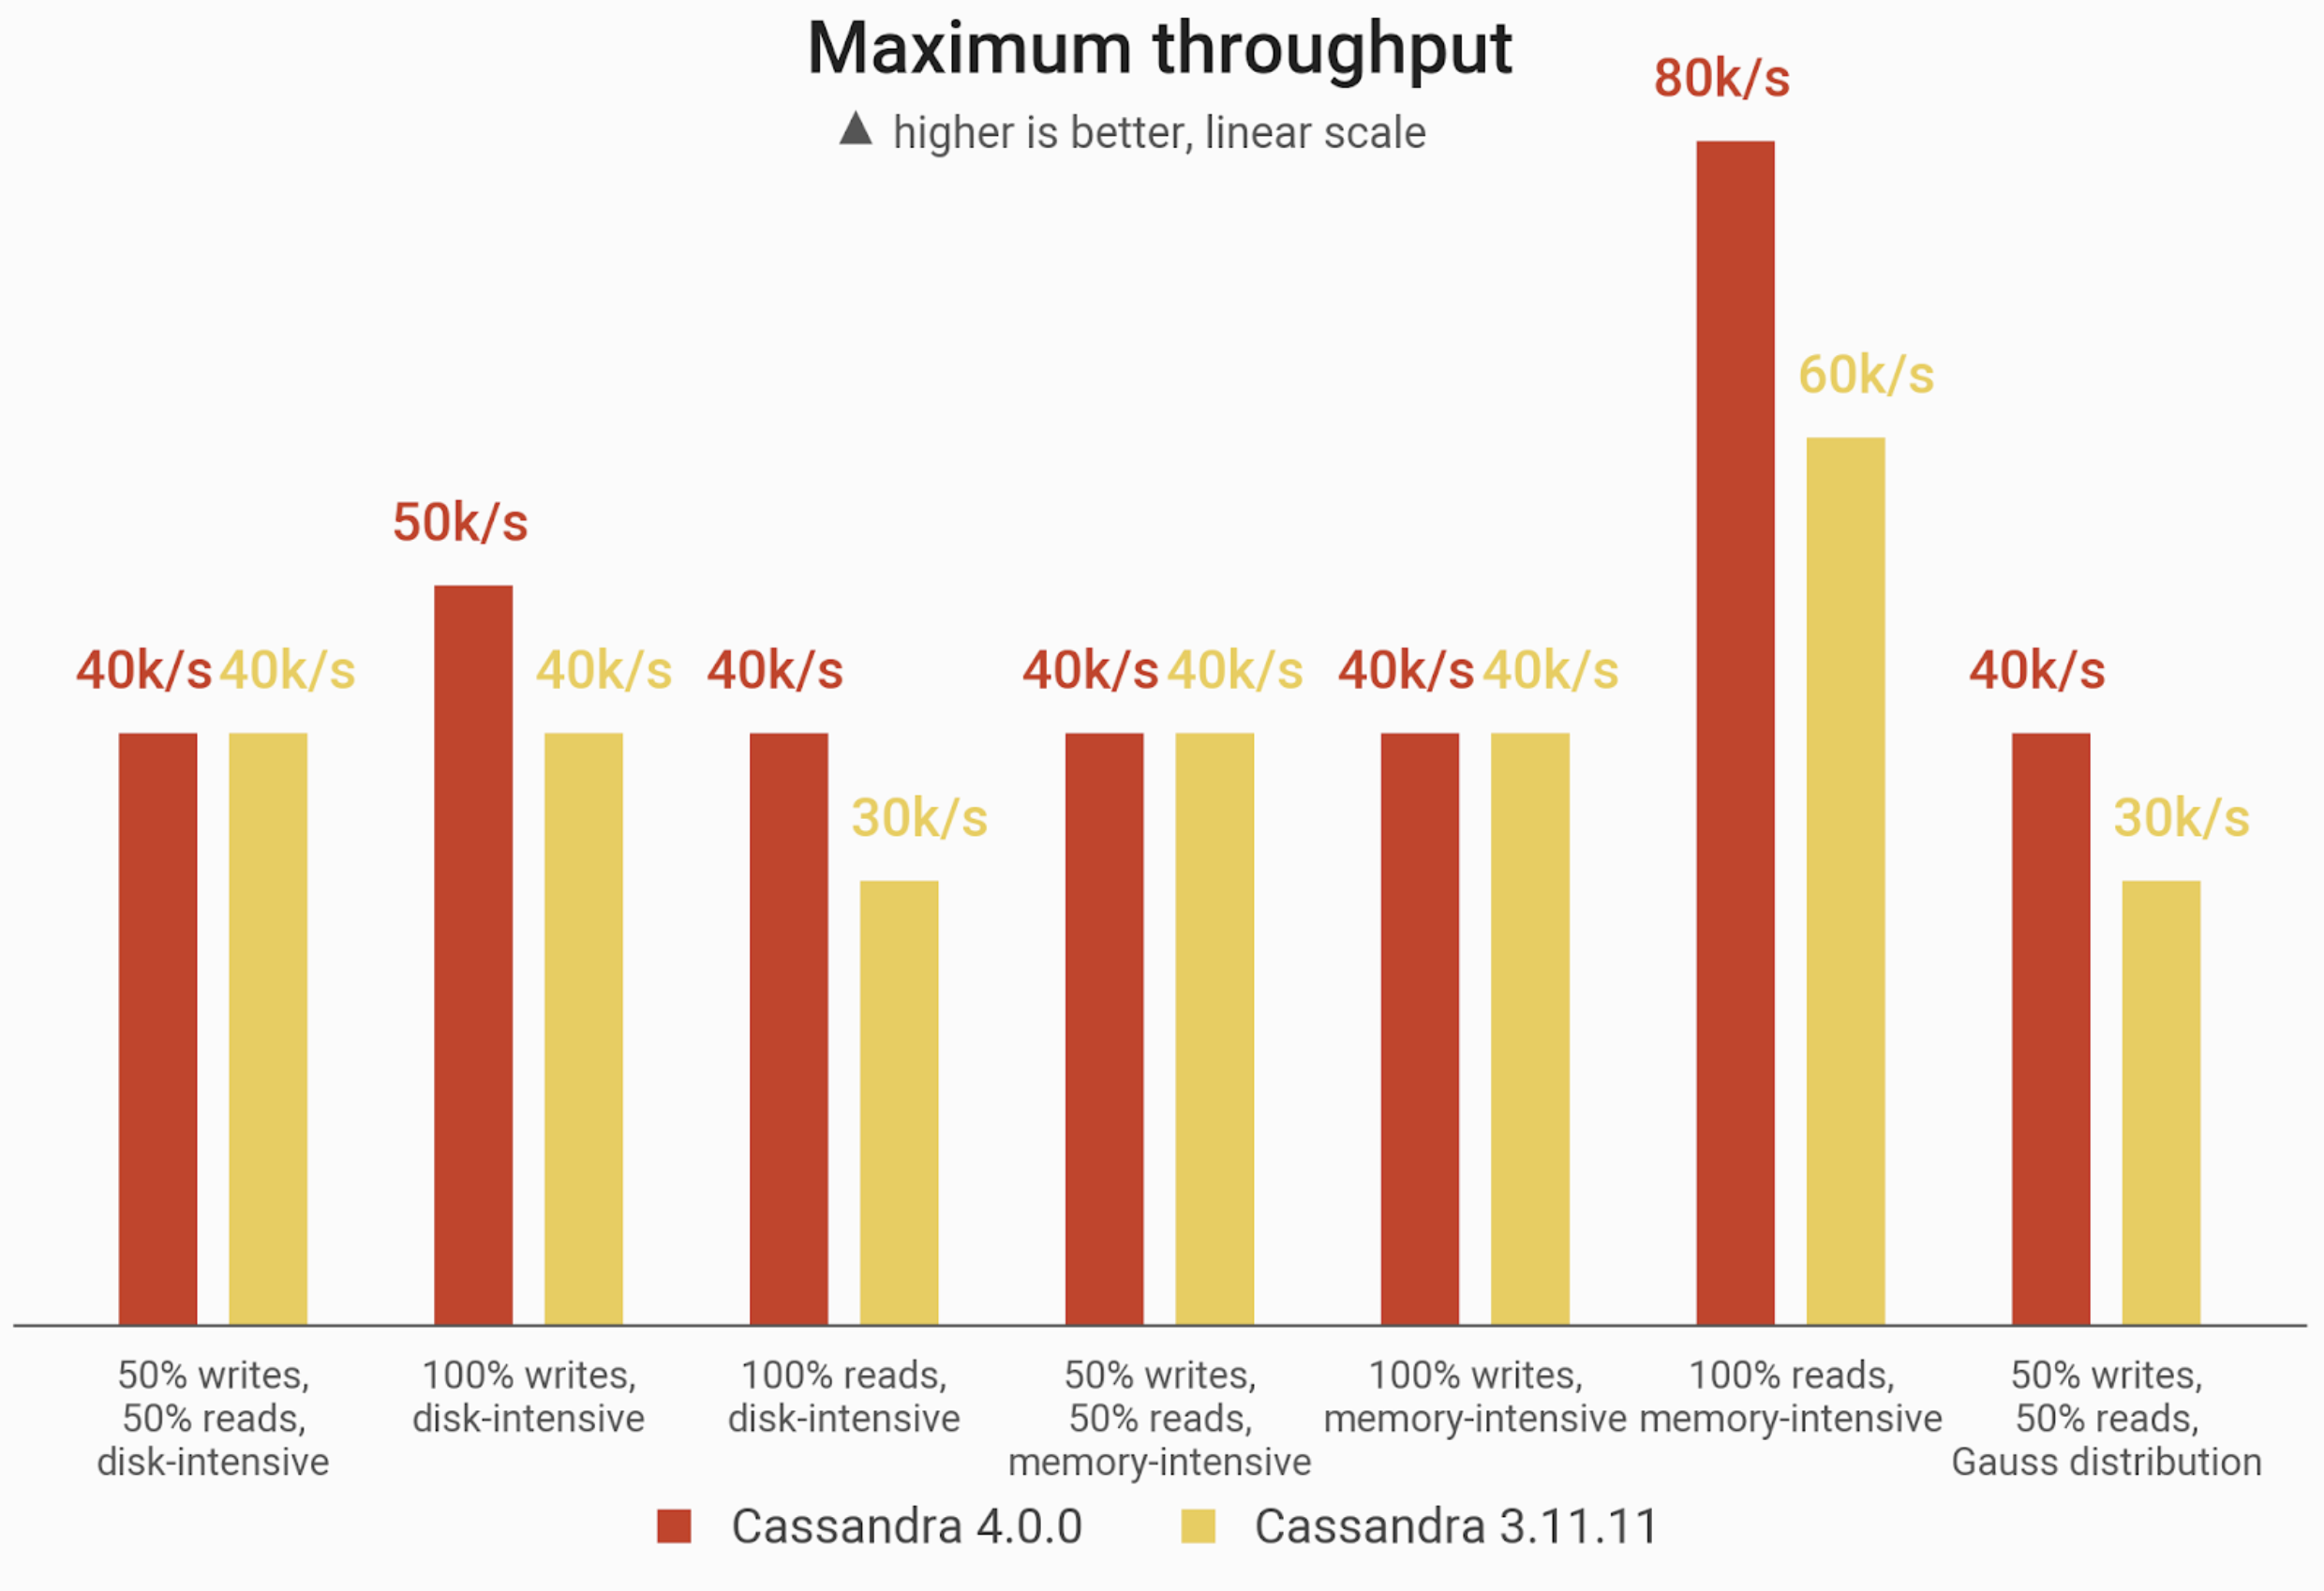
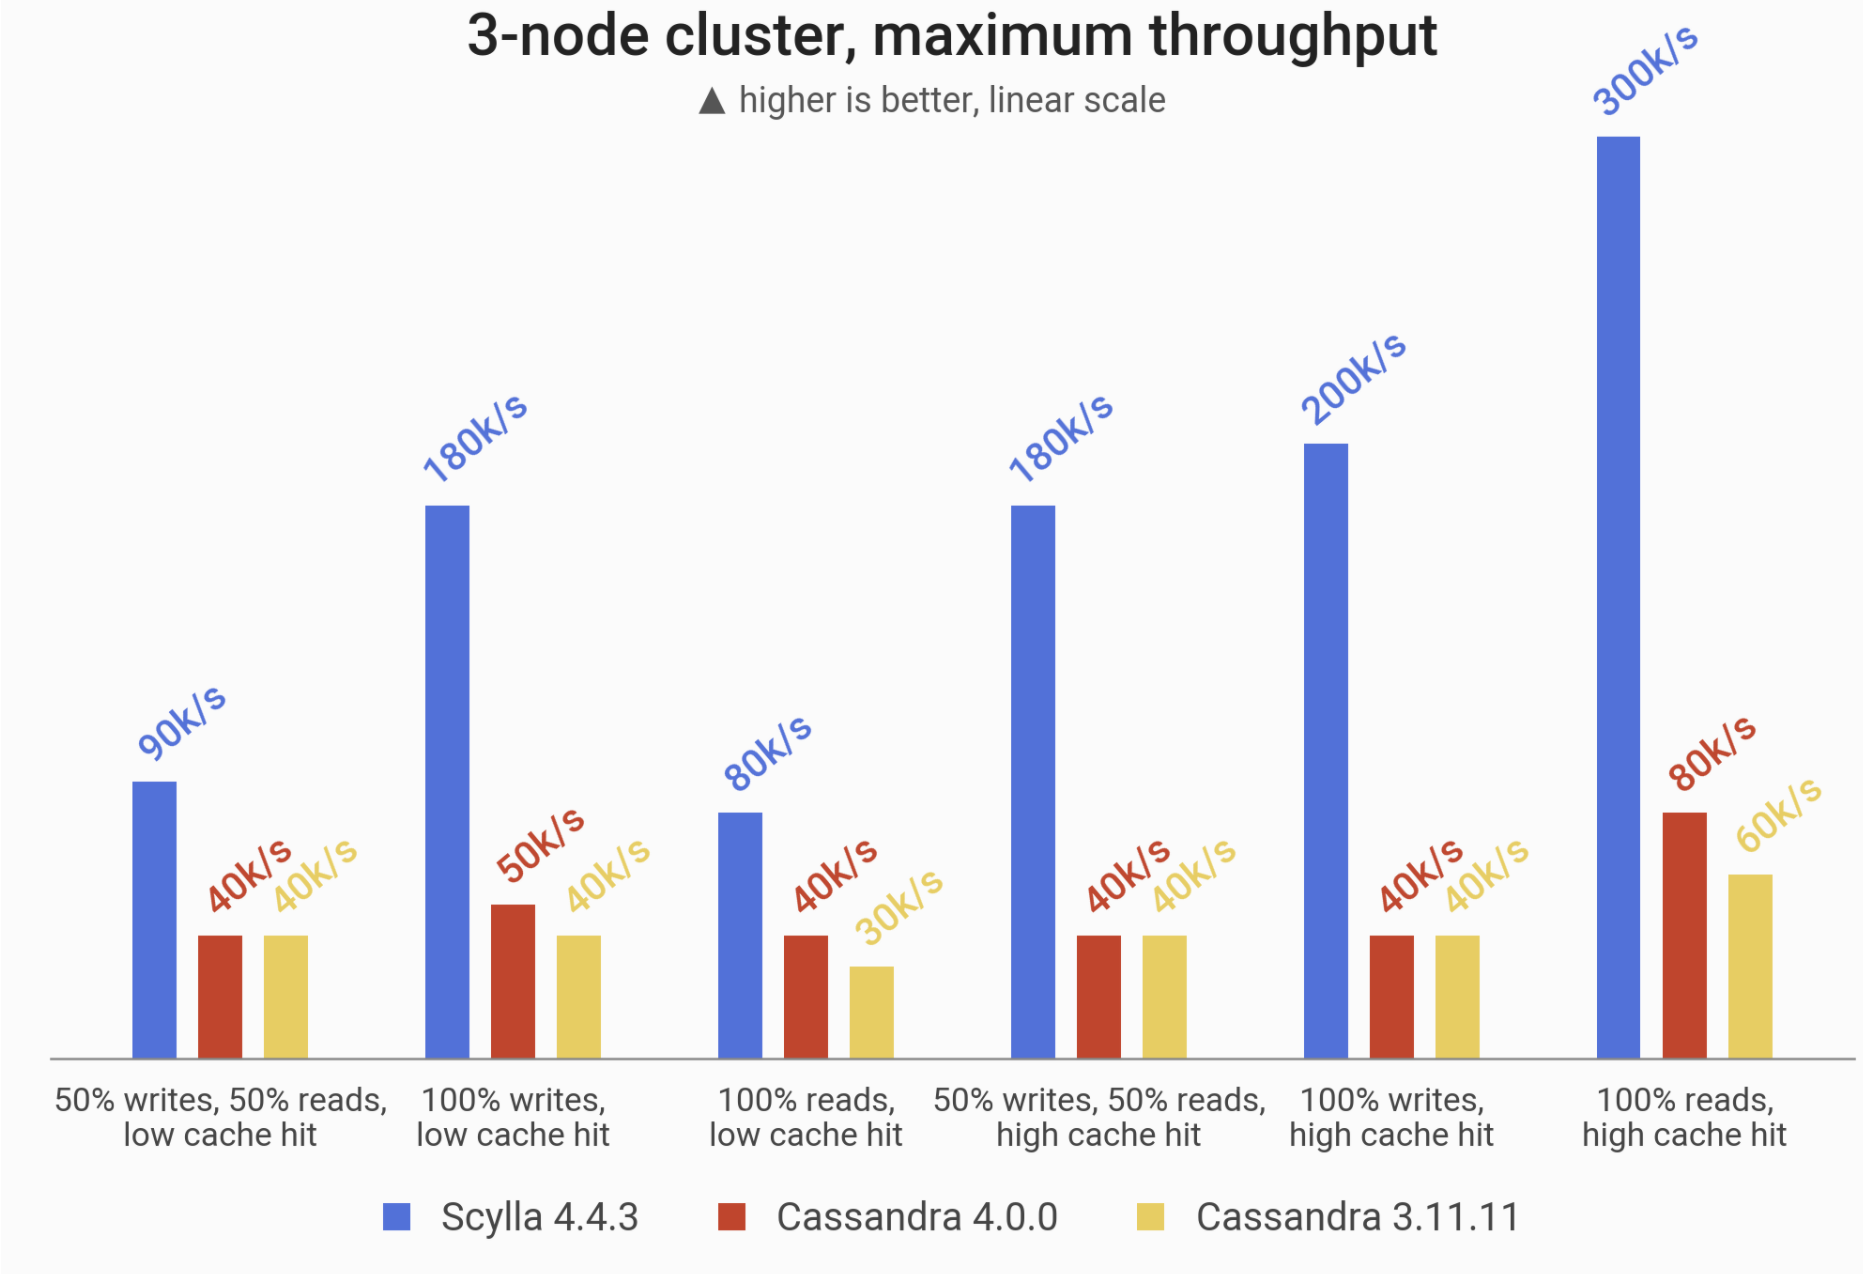
A peek into the results: the maximum throughput (measured in operations per second) achieved on 3 x i3.4xlarge machines (48 vCPUs). Scylla leads the pack, processing from 2x to 5x more requests than either of the Cassandras.
![]()
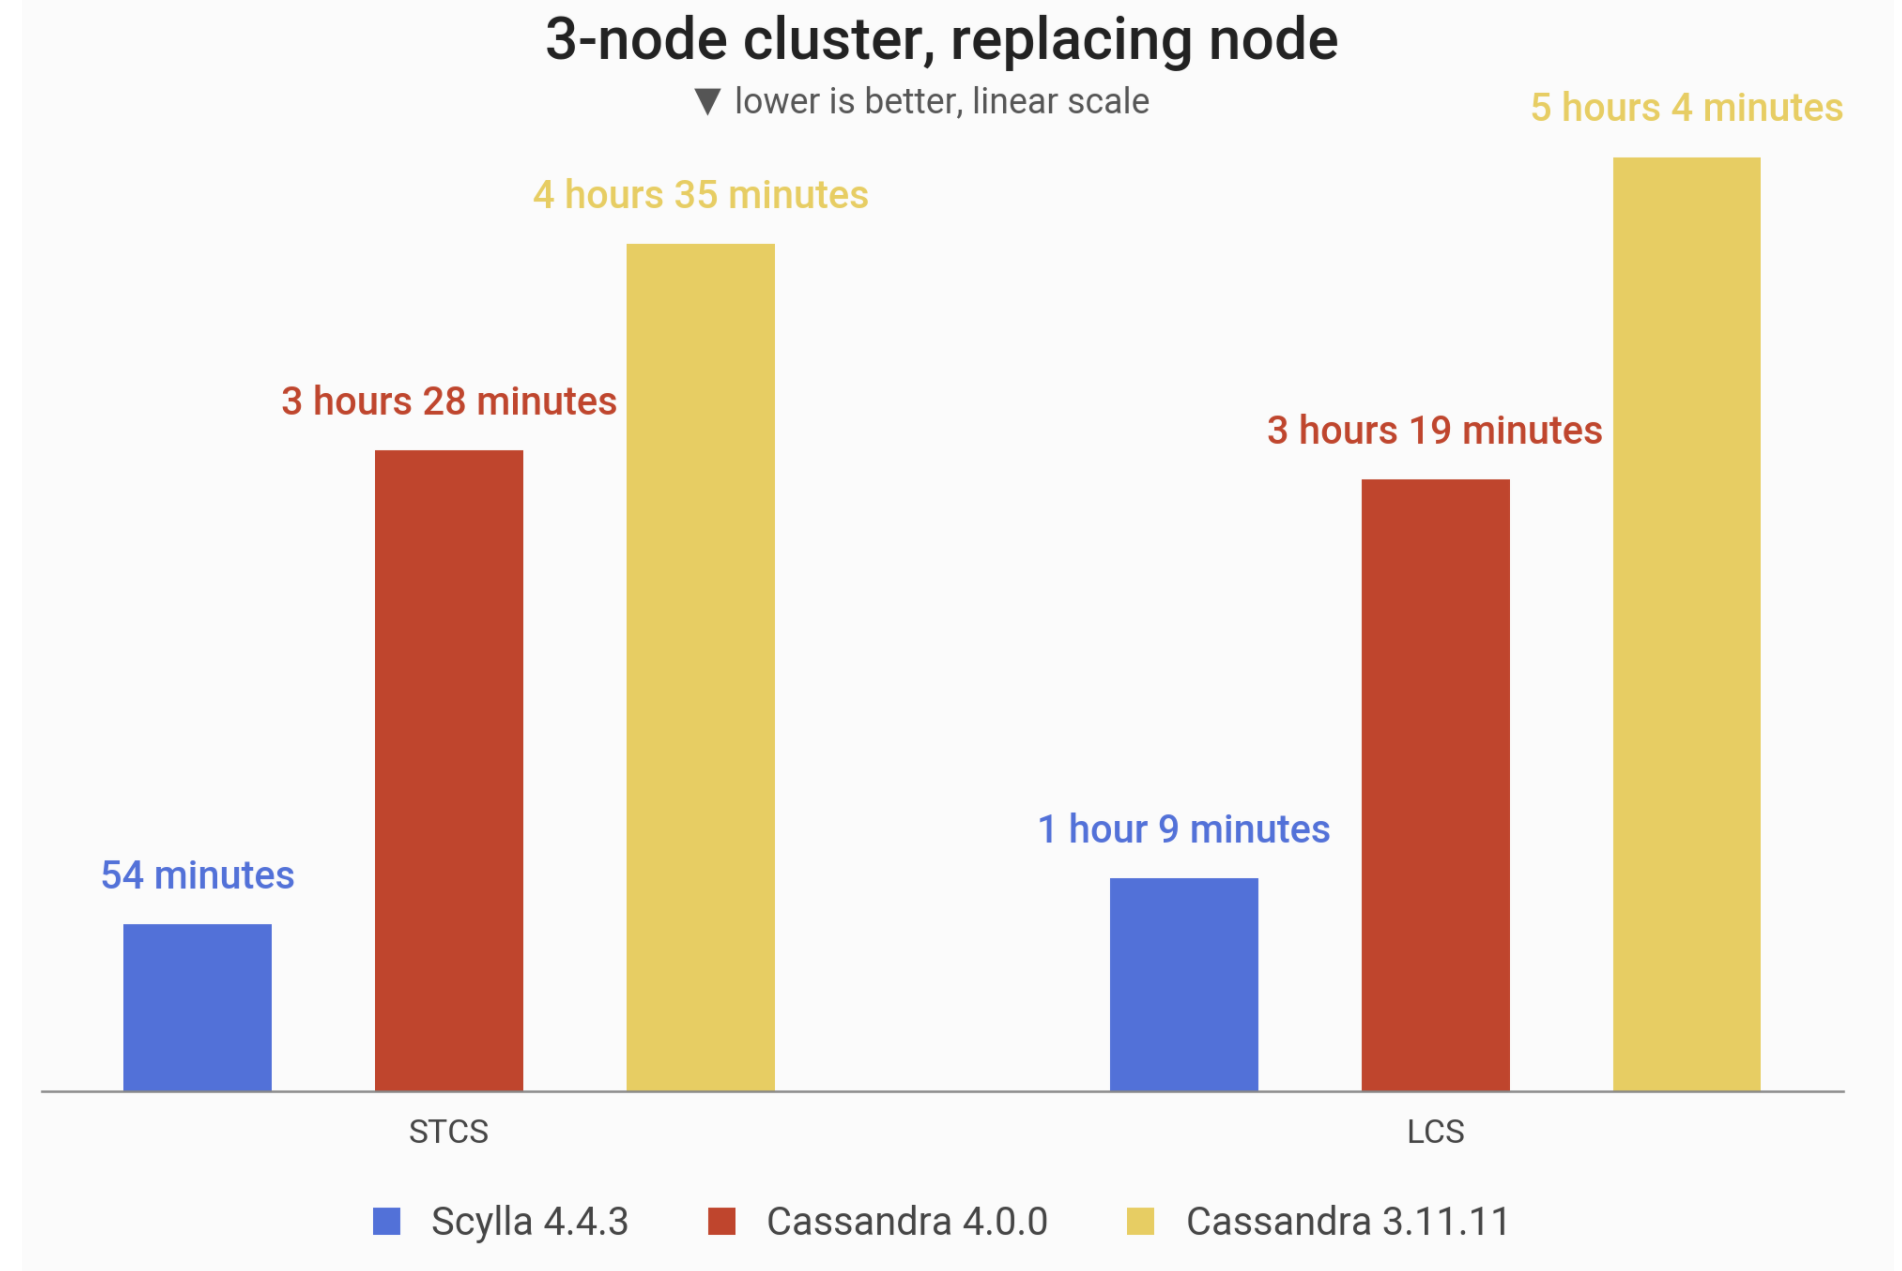
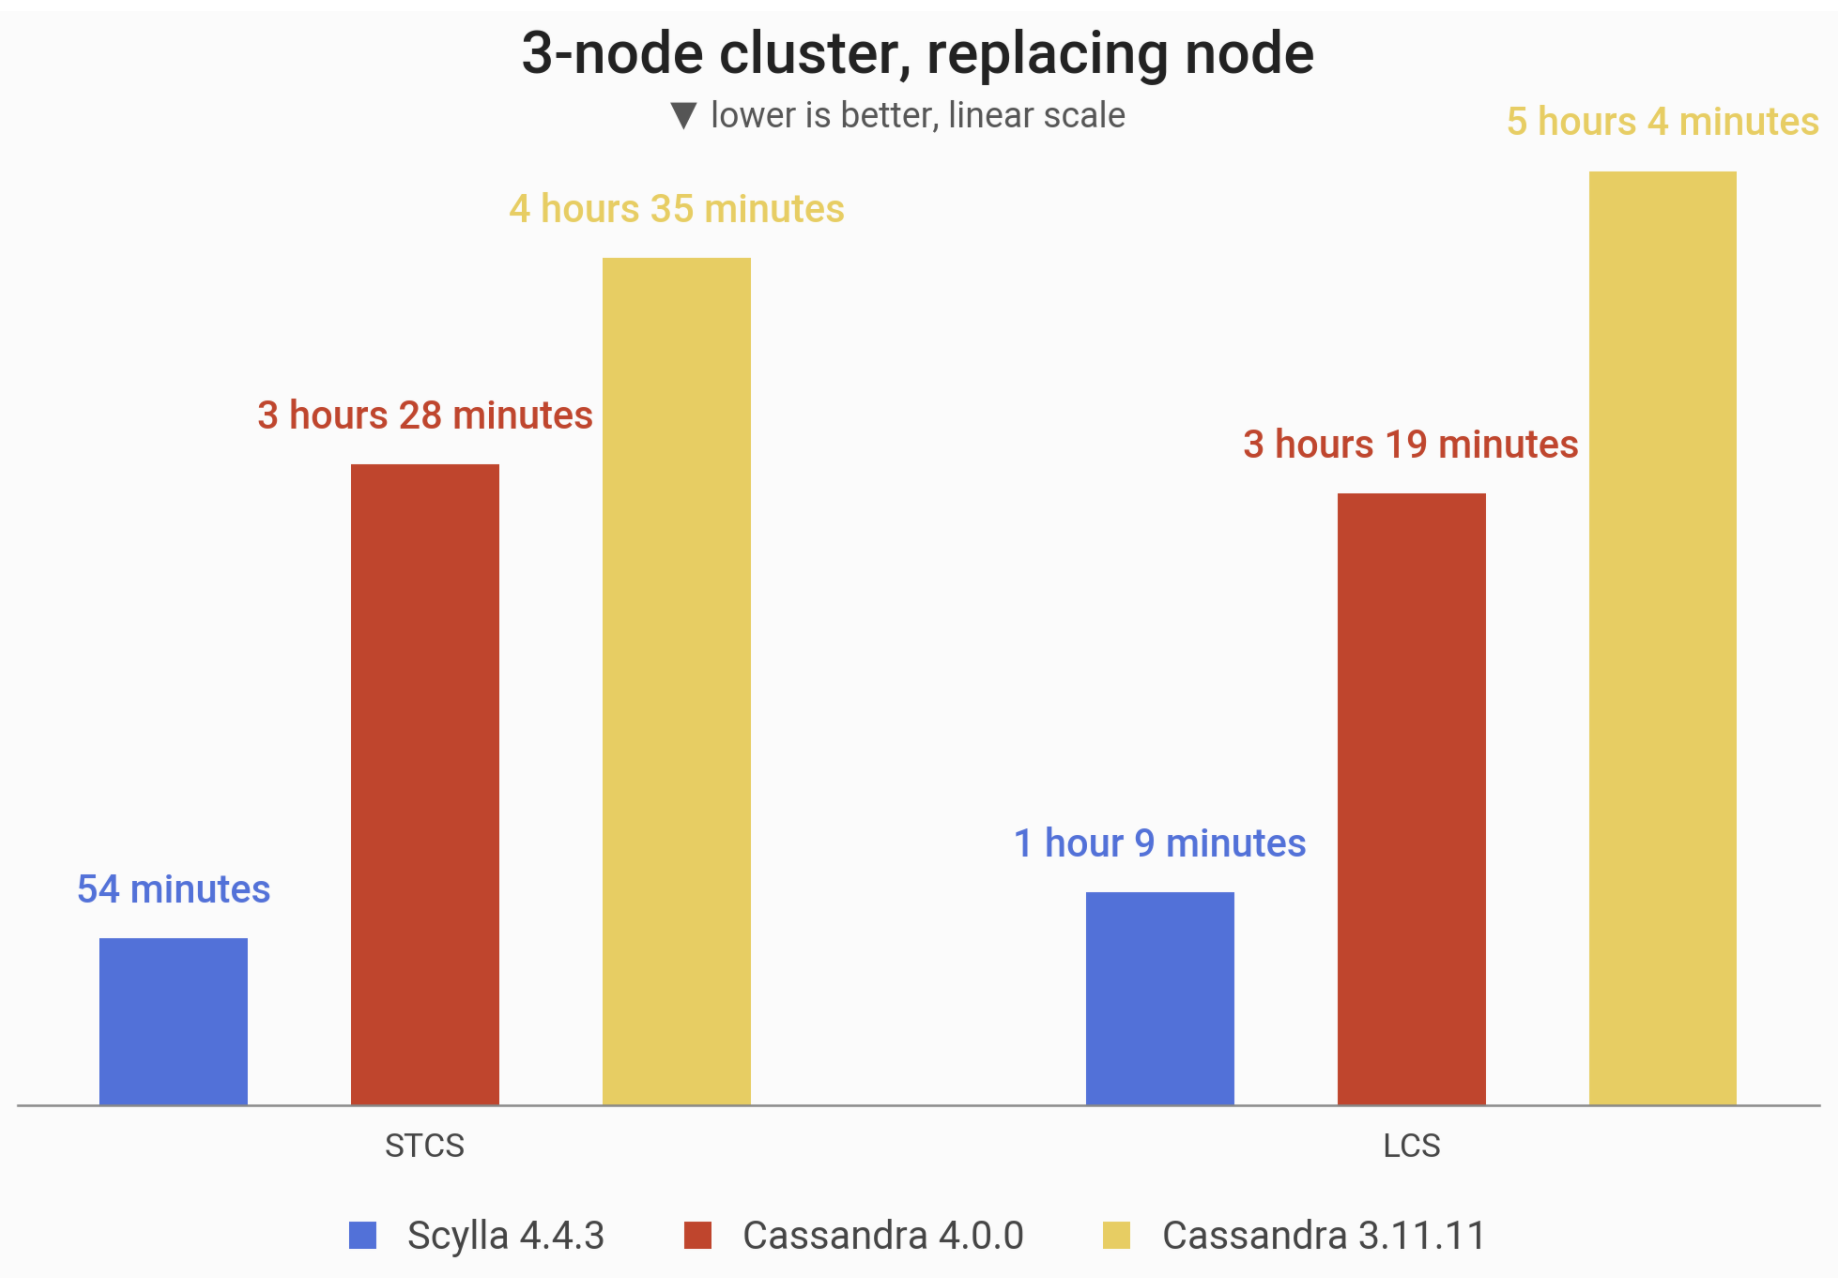
A peek into the results: the time taken by replacing a 1 TB node, measured under Size-Tiered Compaction Strategy (STCS) and Leveled Compaction Strategy (LCS). By default (STCS) Scylla is almost 4x faster than Cassandra 4.0.
![]()
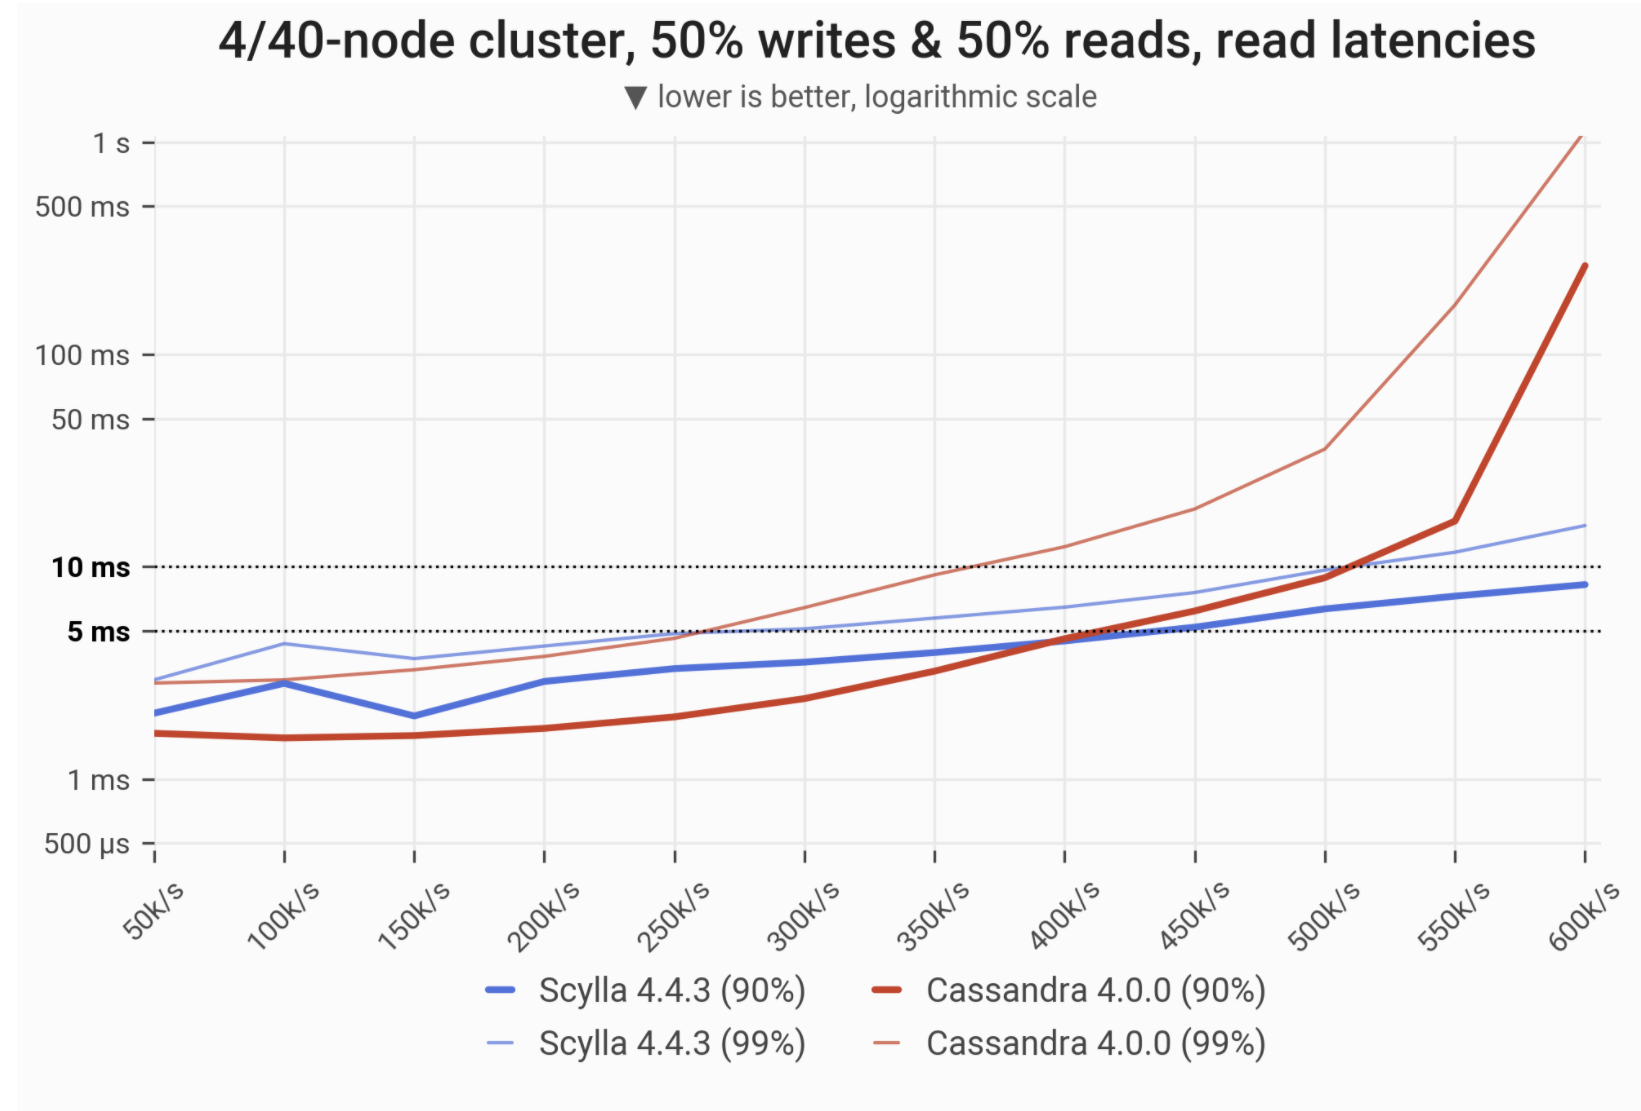
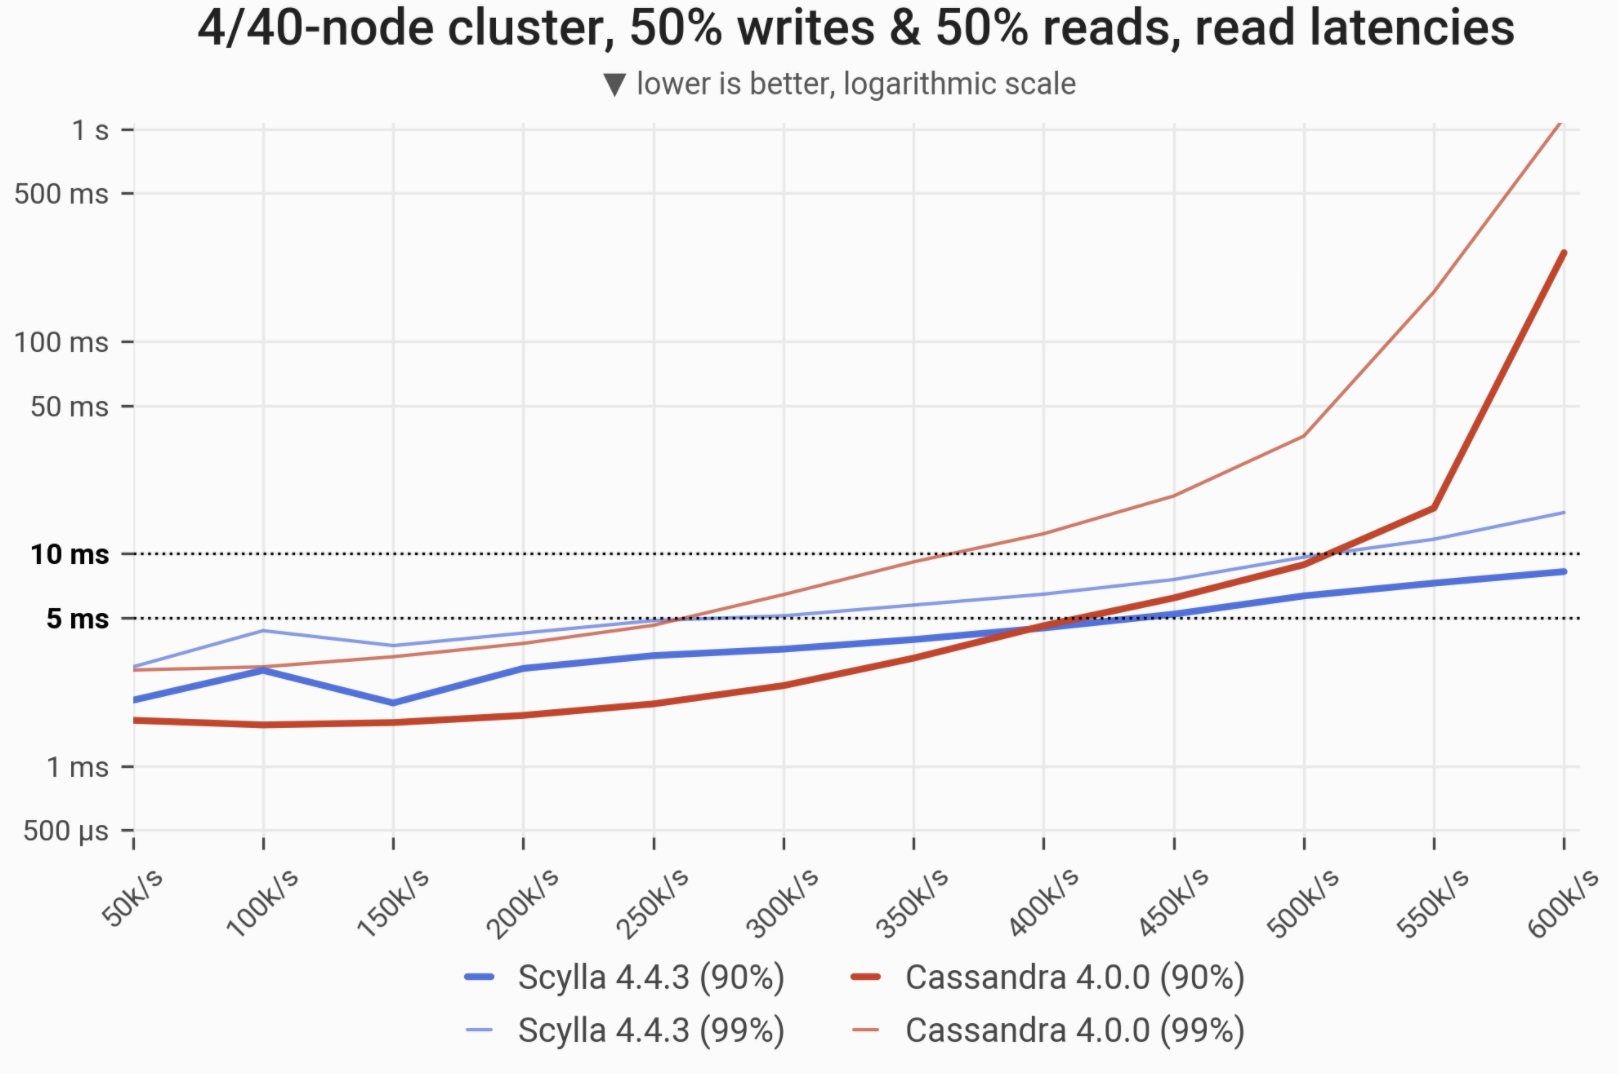
A peek into the results: latencies of SELECT query, as measured on 40 TB cluster on uneven hardware — 4 nodes (288 vCPUs) for Scylla and 40 nodes (640 vCPUs) for Cassandra.
Limitations of Our Testing
It’s important to note that this basic performance analysis does not cover all factors in deciding whether to stay put on Cassandra 3.x, upgrade to Cassandra 4.0, or to migrate to Scylla Open Source 4.4. Users may be wondering if the new features of Cassandra 4.0 are compelling enough, or how changes between implemented features compare between Cassandra and Scylla. For instance, you can read more about the difference in CDC implementations here, and how Scylla’s Lightweight Transactions (LWT) differ from Cassandra’s here. Apart from comparison of basic administrative tasks like adding one or more nodes which is covered below, benchmarking implementation of specific features is beyond the scope of consideration.
Plus there are issues of risk aversion based on stability and maturity for any new software release — for example, the ZGC garbage collector we used currently employs Java 16, which is supported by Cassandra, but not considered production-ready; newer JVMs are not officially supported by Cassandra yet.
Cluster of Three i3.4xlarge Nodes
3-Node Test Setup
The purpose of this test was to compare the performance of Scylla vs. both versions of Cassandra on the exact same hardware. We wanted to use relatively typical current generation servers on AWS so that others could replicate our tests, and reflect a real-world setup.
|
Cassandra/Scylla |
Loaders |
| EC2 Instance type |
i3.4xlarge |
c5n.9xlarge |
| Cluster size |
3 |
3 |
| vCPUs (total) |
16 (48) |
36 (108) |
| RAM (total) |
122 (366) GiB |
96 (288) GiB |
| Storage (total) |
2x 1.9TB NVMe in RAID0 (3.8 TB) |
Not important for a loader (EBS-only) |
| Network |
Up to 10 Gbps |
50 Gbps |
We set up our cluster on Amazon EC2, in a single Availability Zone within us-east-2. Database cluster servers were initialized with clean machine images (AMIs), running CentOS 7.9 with Scylla Open Source 4.4 and Ubuntu 20.04 with Cassandra 4.0 or Cassandra 3.11 (which we’ll refer to as “C*4” and “C*3”, respectively).
Apart from the cluster, three loader machines were employed to run cassandra-stress in order to insert data and, later, provide background load to mess with the administrative operations.
Once up and running, the databases were loaded by cassandra-stress with random data organized into the default schema at RF=3. The loading continues until the cluster’s total disk usage reaches approx. 3 TB (or 1 TB per node). The exact disk occupancy would, of course, depend on running compactions and the size of other related files (commitlogs, etc.). Based on the size of the payload, this translated to ~3.43 billion partitions. Then we flushed the data and waited until the compactions finished, so we can start the actual benchmarking.
Throughput and Latencies
The actual benchmarking is a series of simple invocations of cassandra-stress with CL=QUORUM. For 30 minutes we keep firing 10,000 requests per second and monitor the latencies. Then we increase the request rate by another 10,000 for another 30 min, and so on. (20,000 in case of larger throughputs). The procedure repeats until the DB is no longer capable of withstanding the traffic, i.e. until cassandra-stress cannot achieve the desired throughput or until the 90-percentile latencies exceed 1 second.
Note: This approach means that throughput numbers are presented with 10k/s granularity (in some cases 20k/s).
We have tested our databases with the following distributions of data:
- “Real-life” (Gaussian) distribution, with sensible cache-hit ratios of 30-60%
- Uniform distribution, with a close-to-zero cache hit ratio
- “In-memory” distribution, expected to yield almost 100% cache hits
Within these scenarios we ran the following workloads:
- 100% writes
- 100% reads
- 50% writes and 50% reads
“Real-life” (Gaussian) Distribution
In this scenario we issue queries that touch partitions randomly drawn from a narrow Gaussian distribution. We make an Ansatz about the bell curve: we assume that its six-sigma spans the RAM of the cluster (corrected for the replication factor). The purpose of this experiment is to model a realistic workload, with a substantial cache hit ratio but less than 100%, because most of our users observe the figures of 60-90%. We can expect Cassandra to perform well in this scenario because its key cache is denser than Scylla’s, i.e. it efficiently stores data in RAM, though it relies on SSTables stored in the OS page cache which can be heavyweight to look up. By comparison, Scylla uses a row-based cache mechanism. This Gaussian distribution test should indicate which uses the more efficient caching mechanism for reads.
Mixed Workload – 50% reads and 50% writes
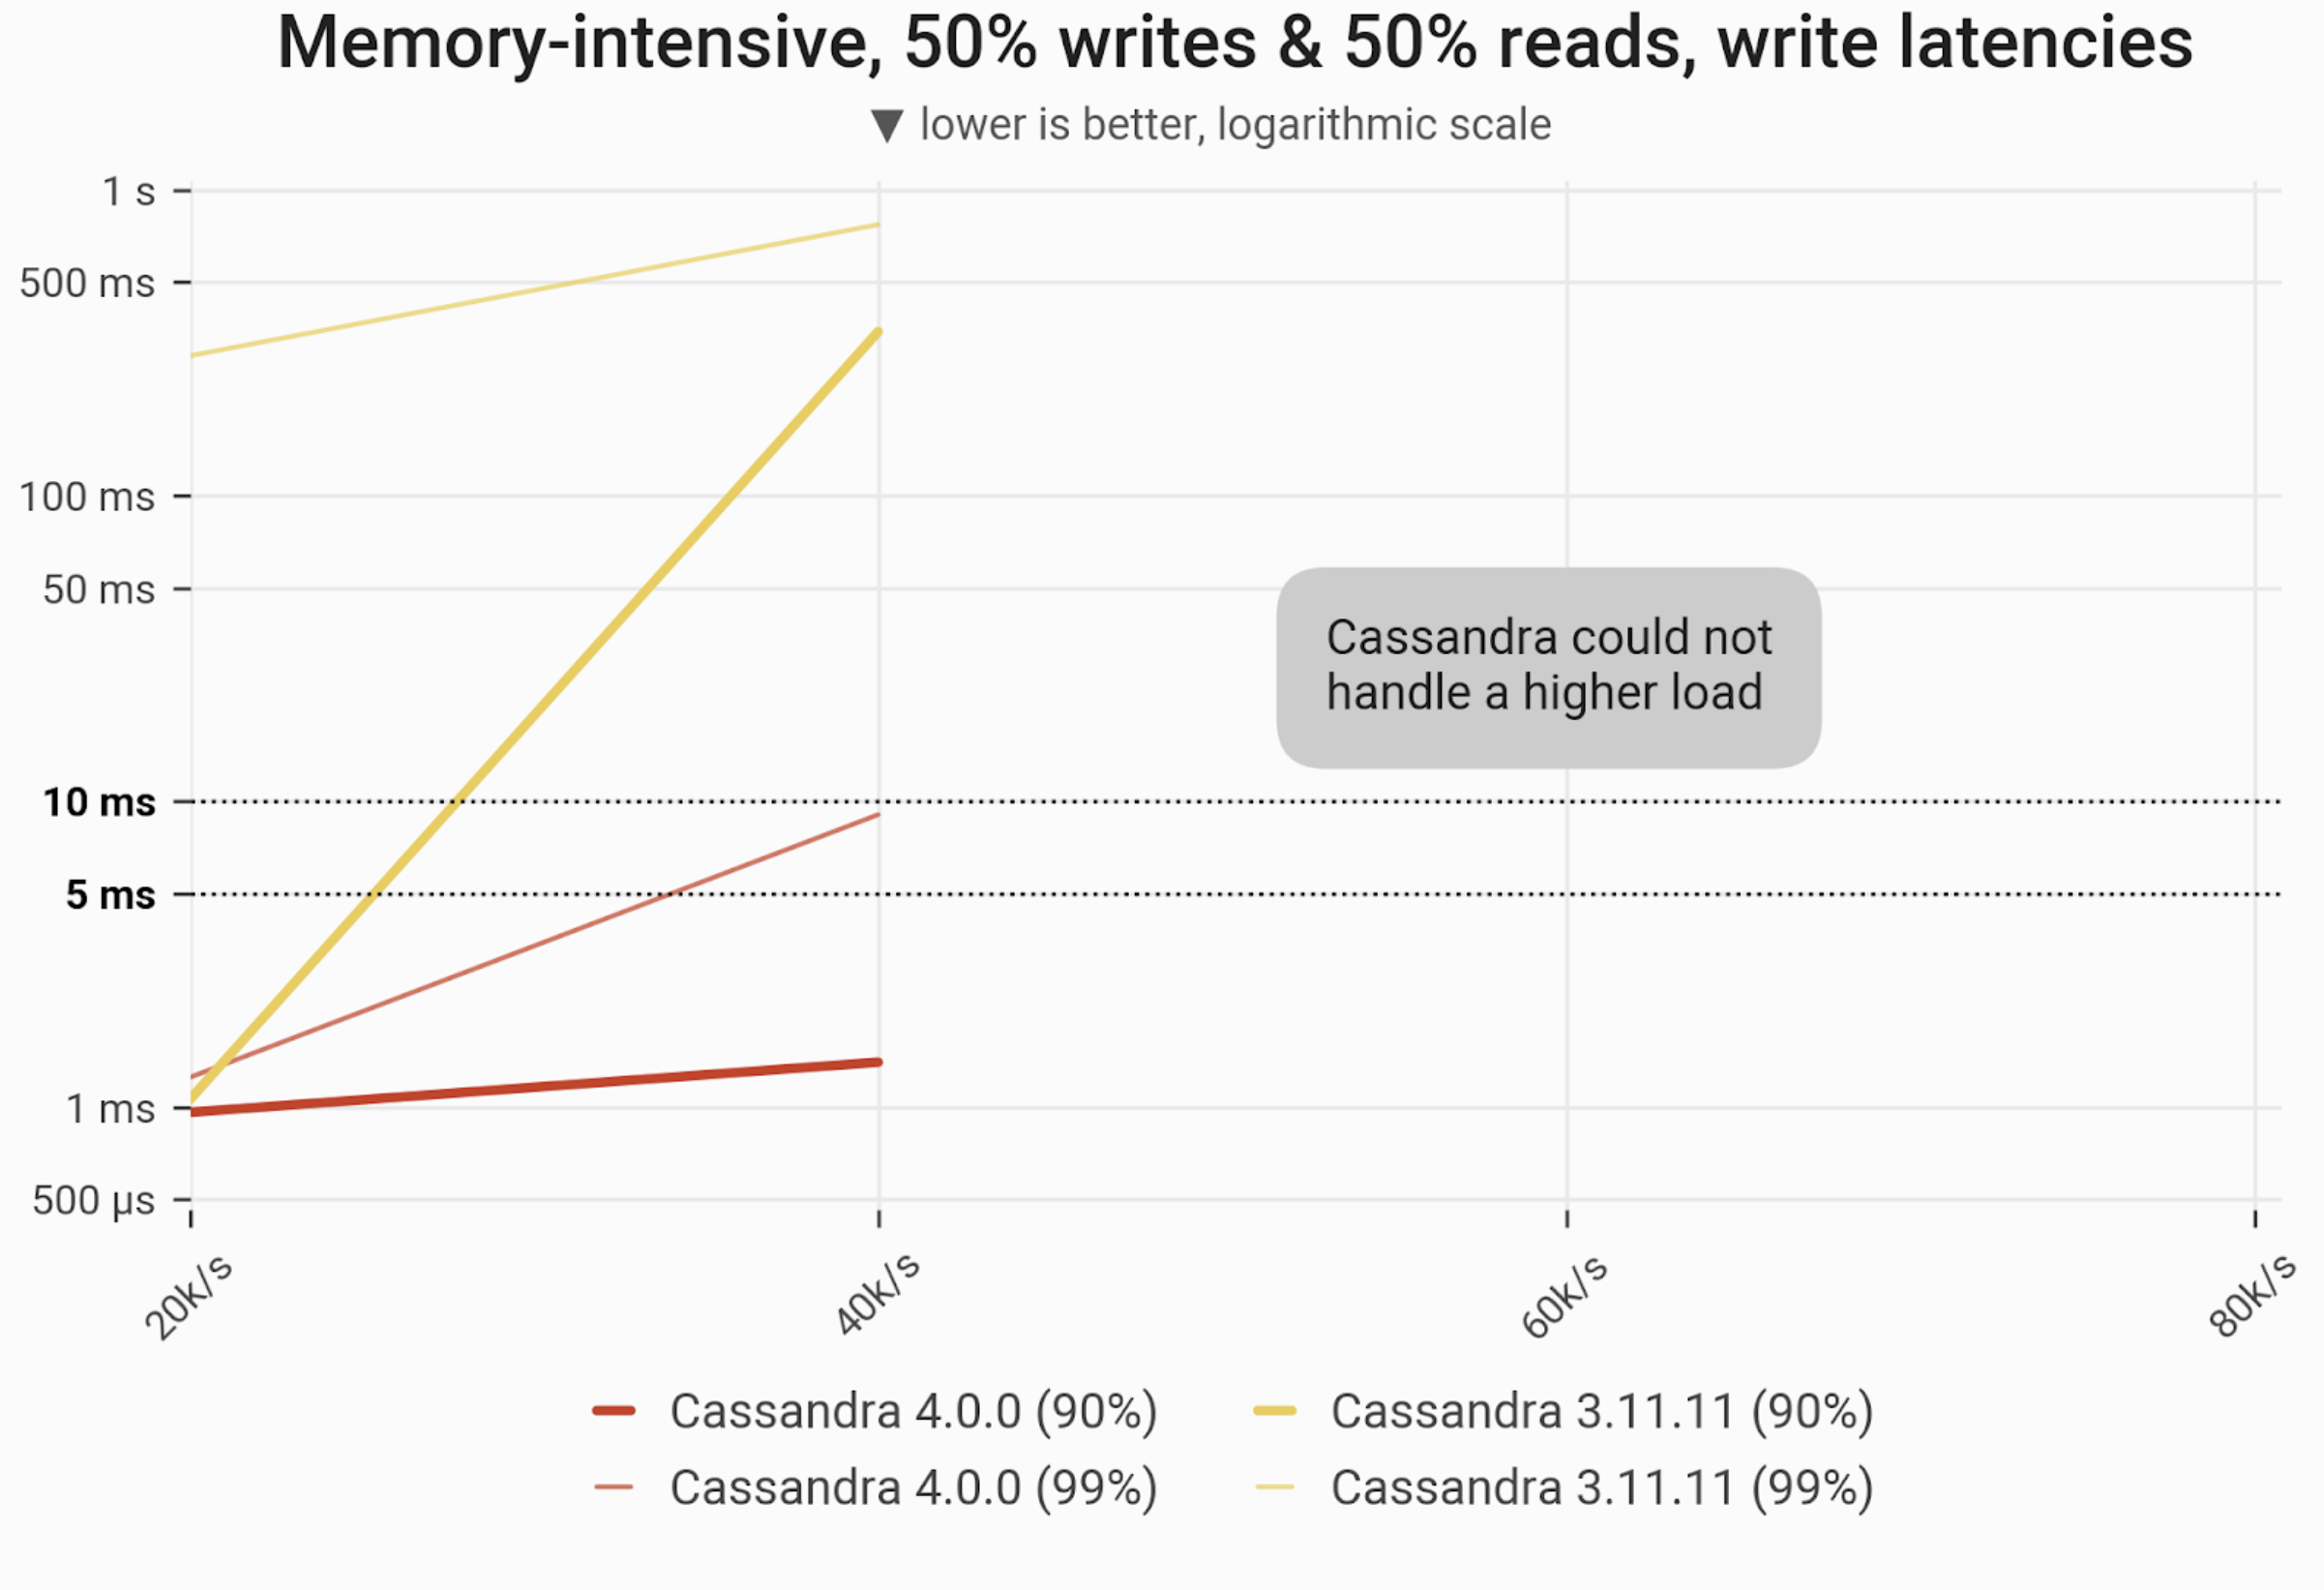
![]()
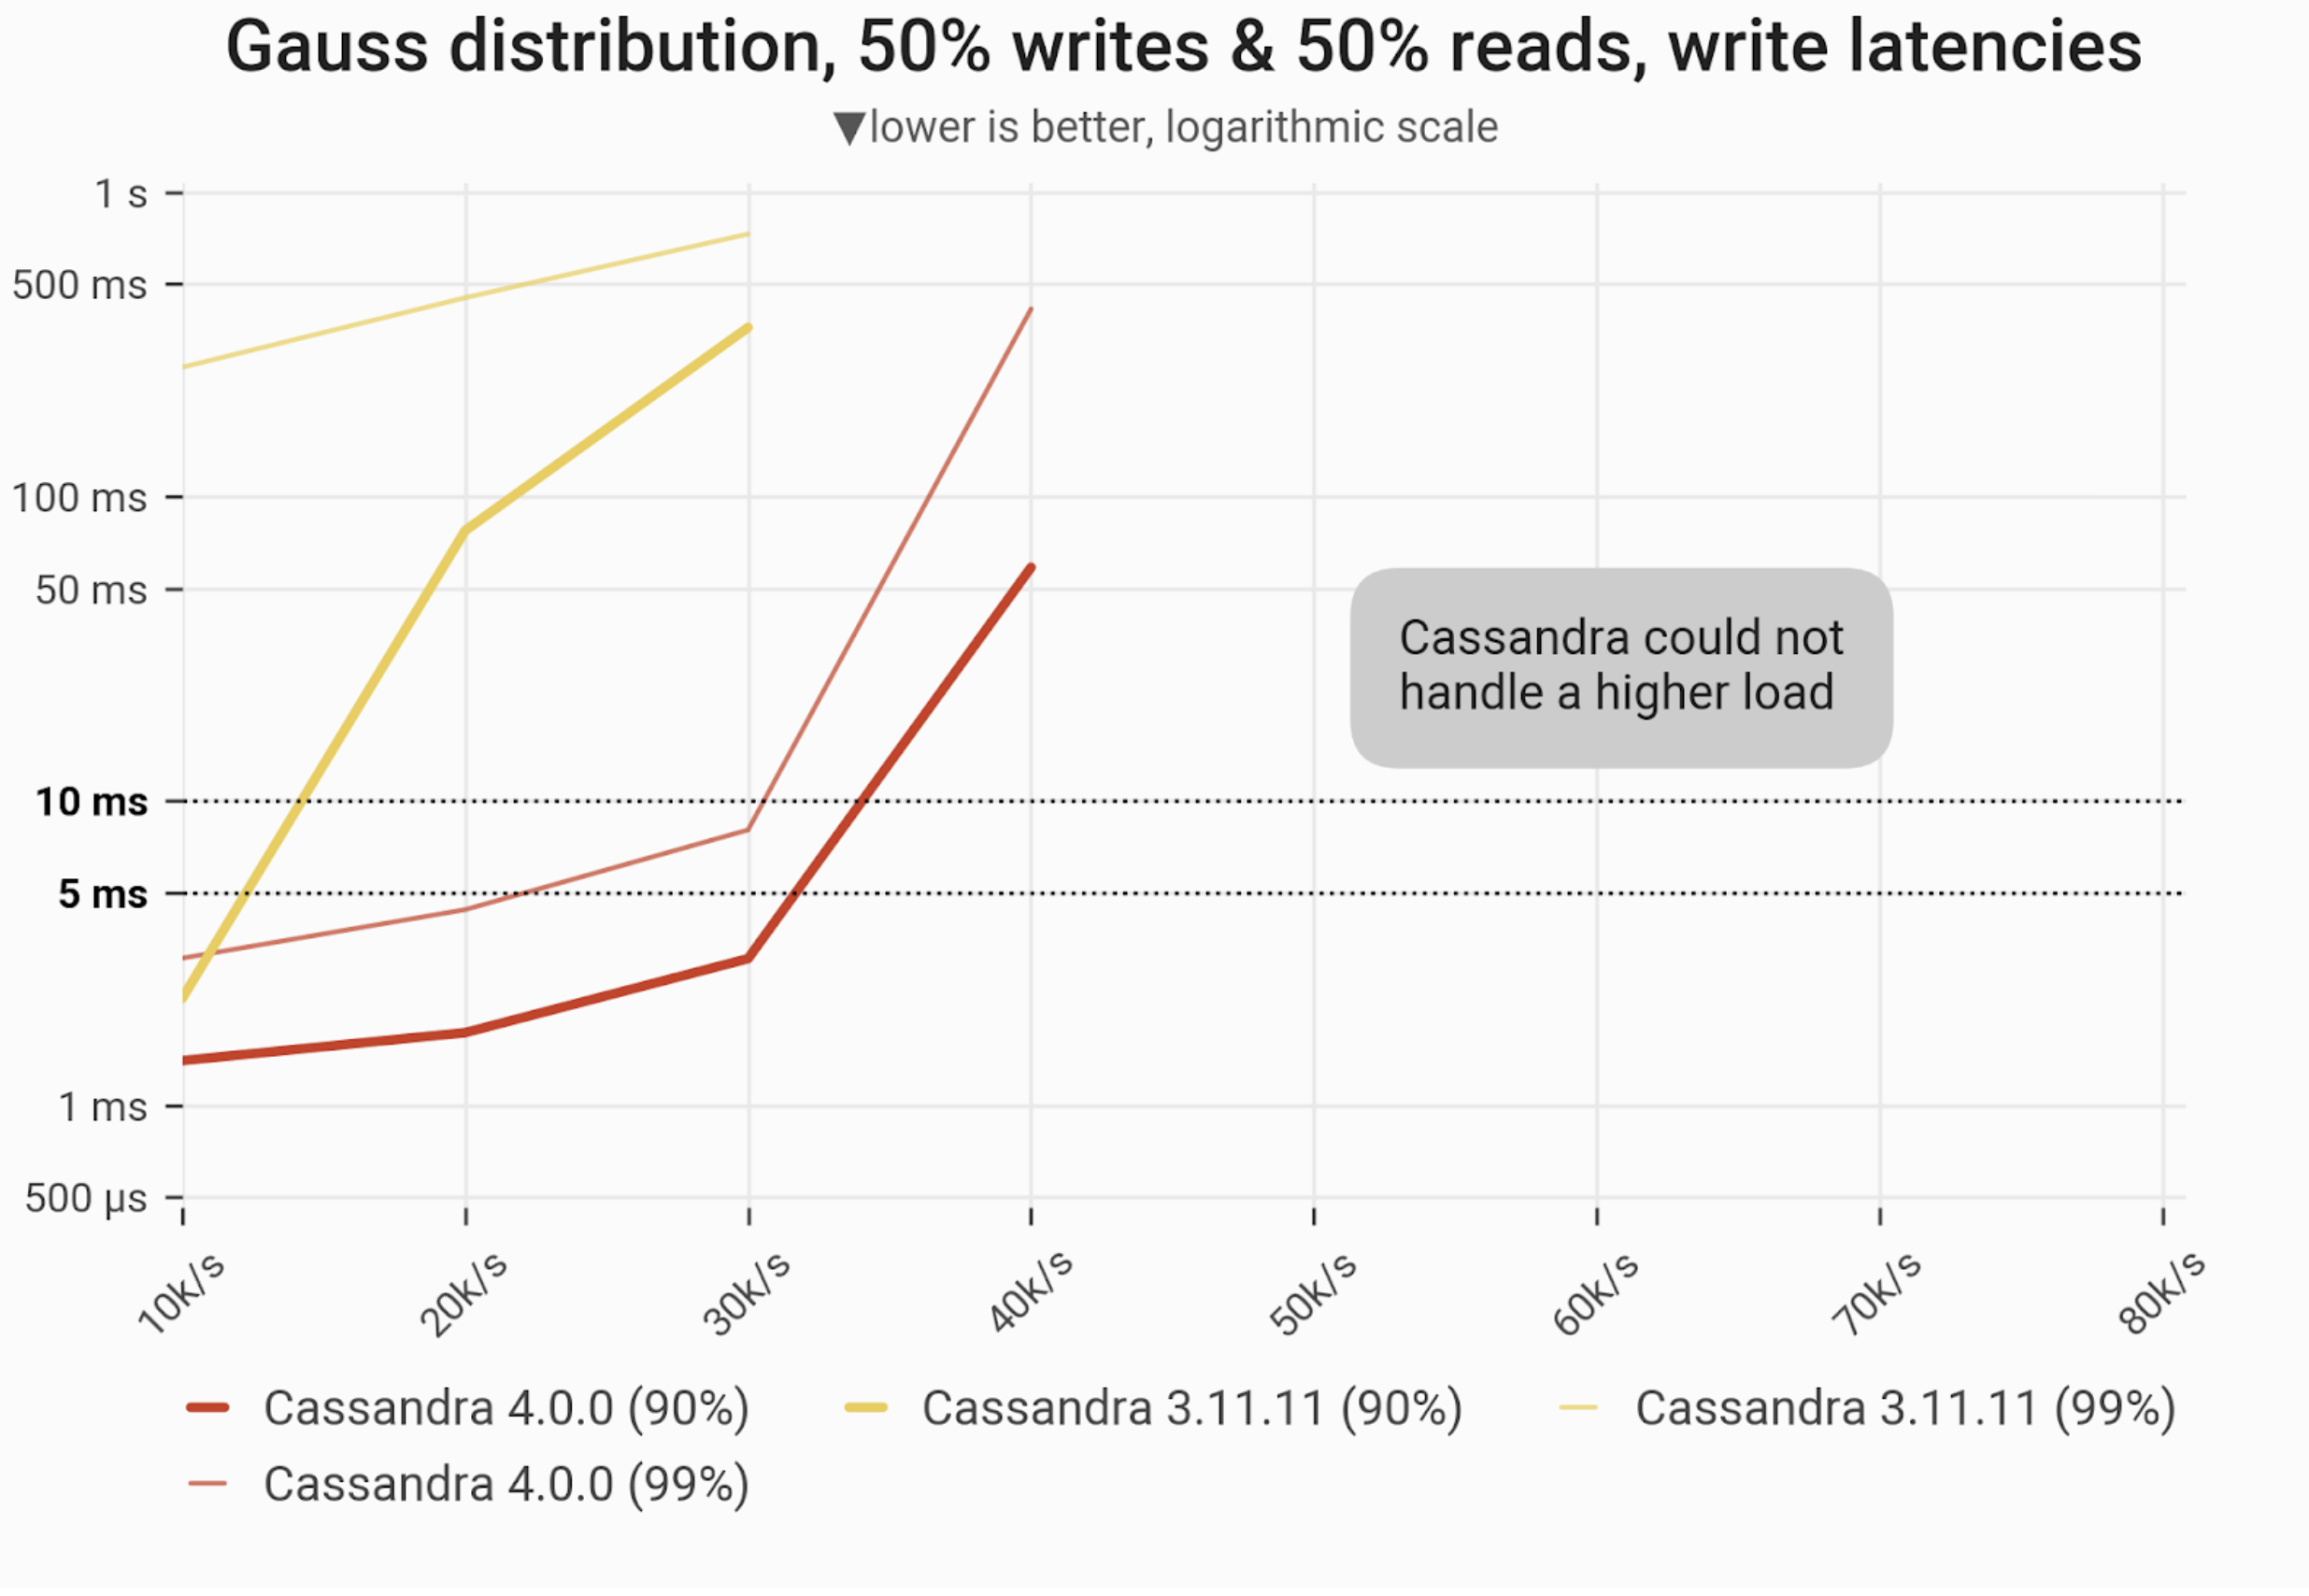
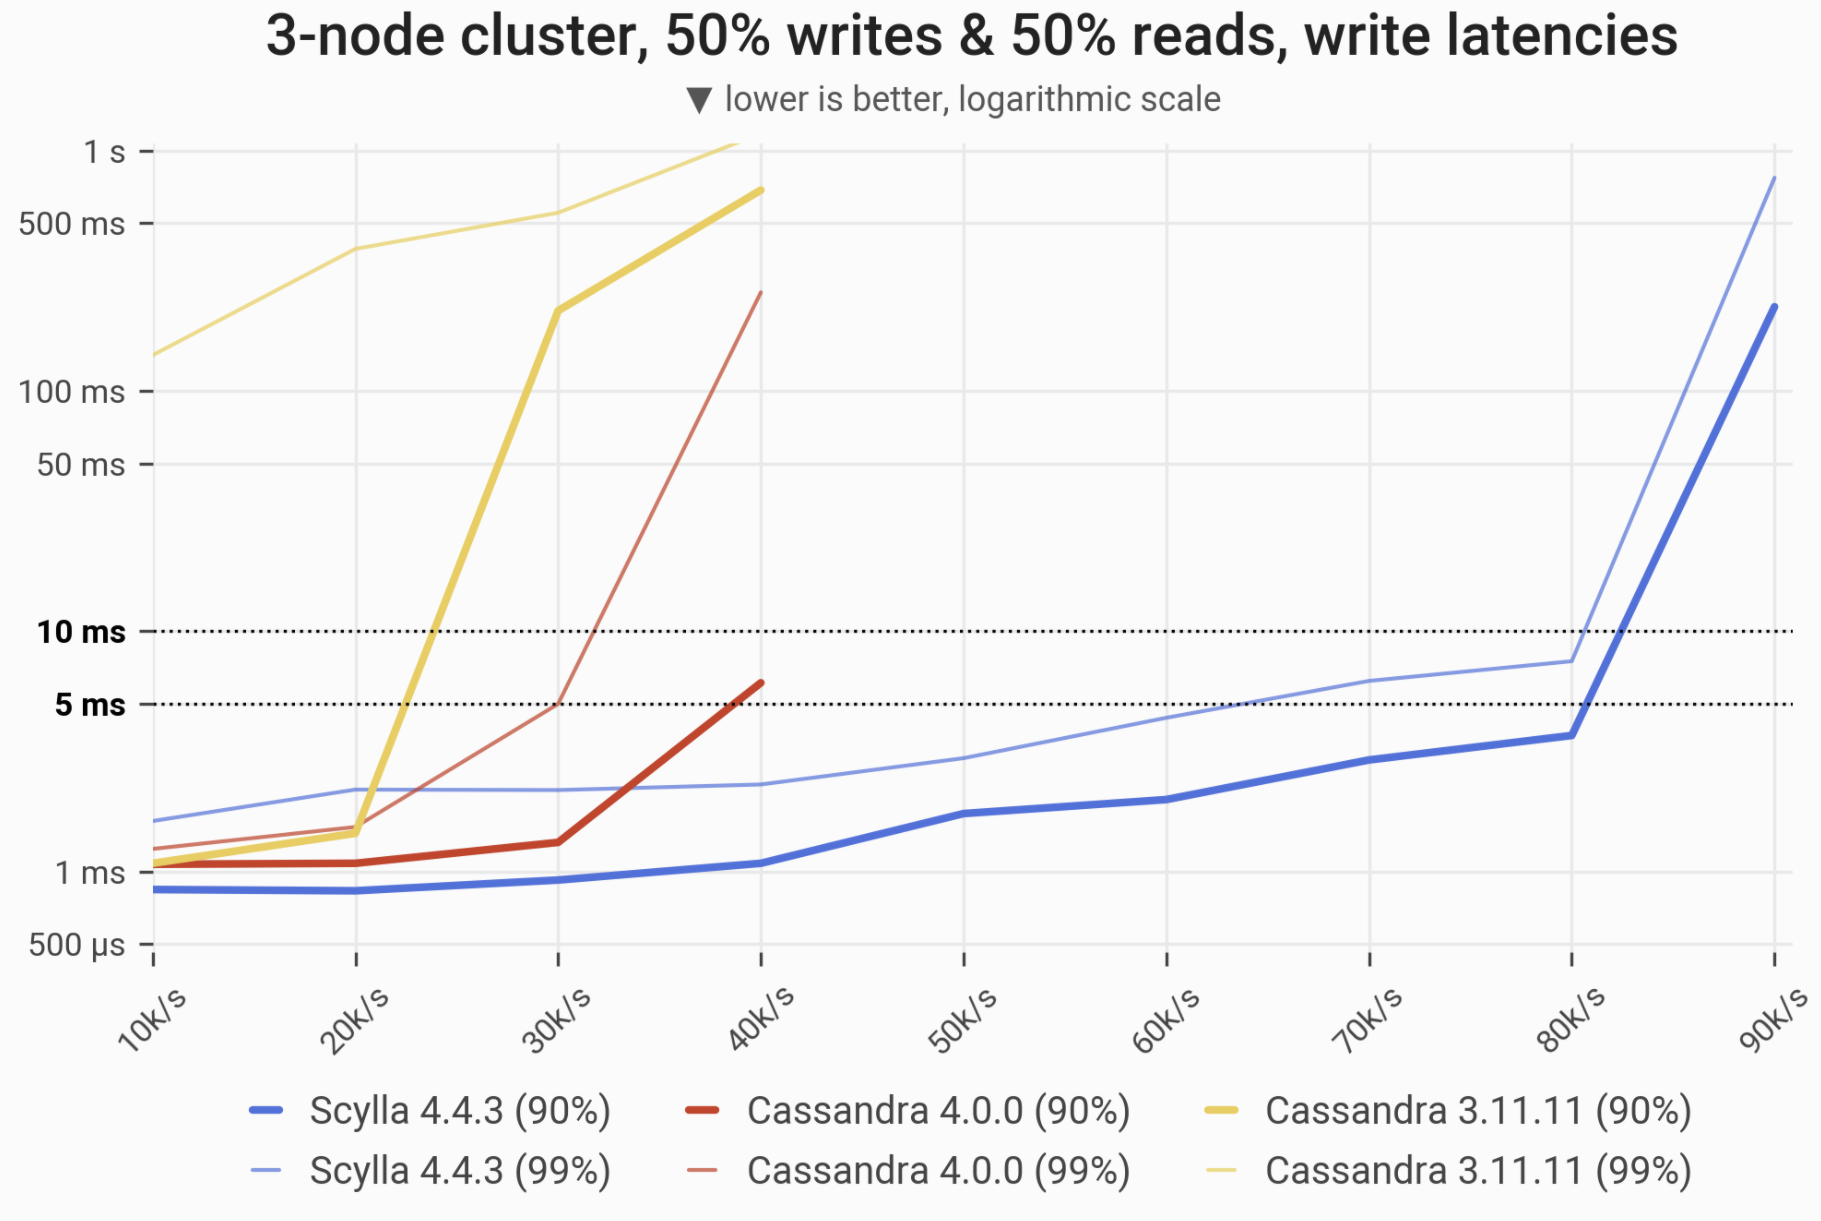
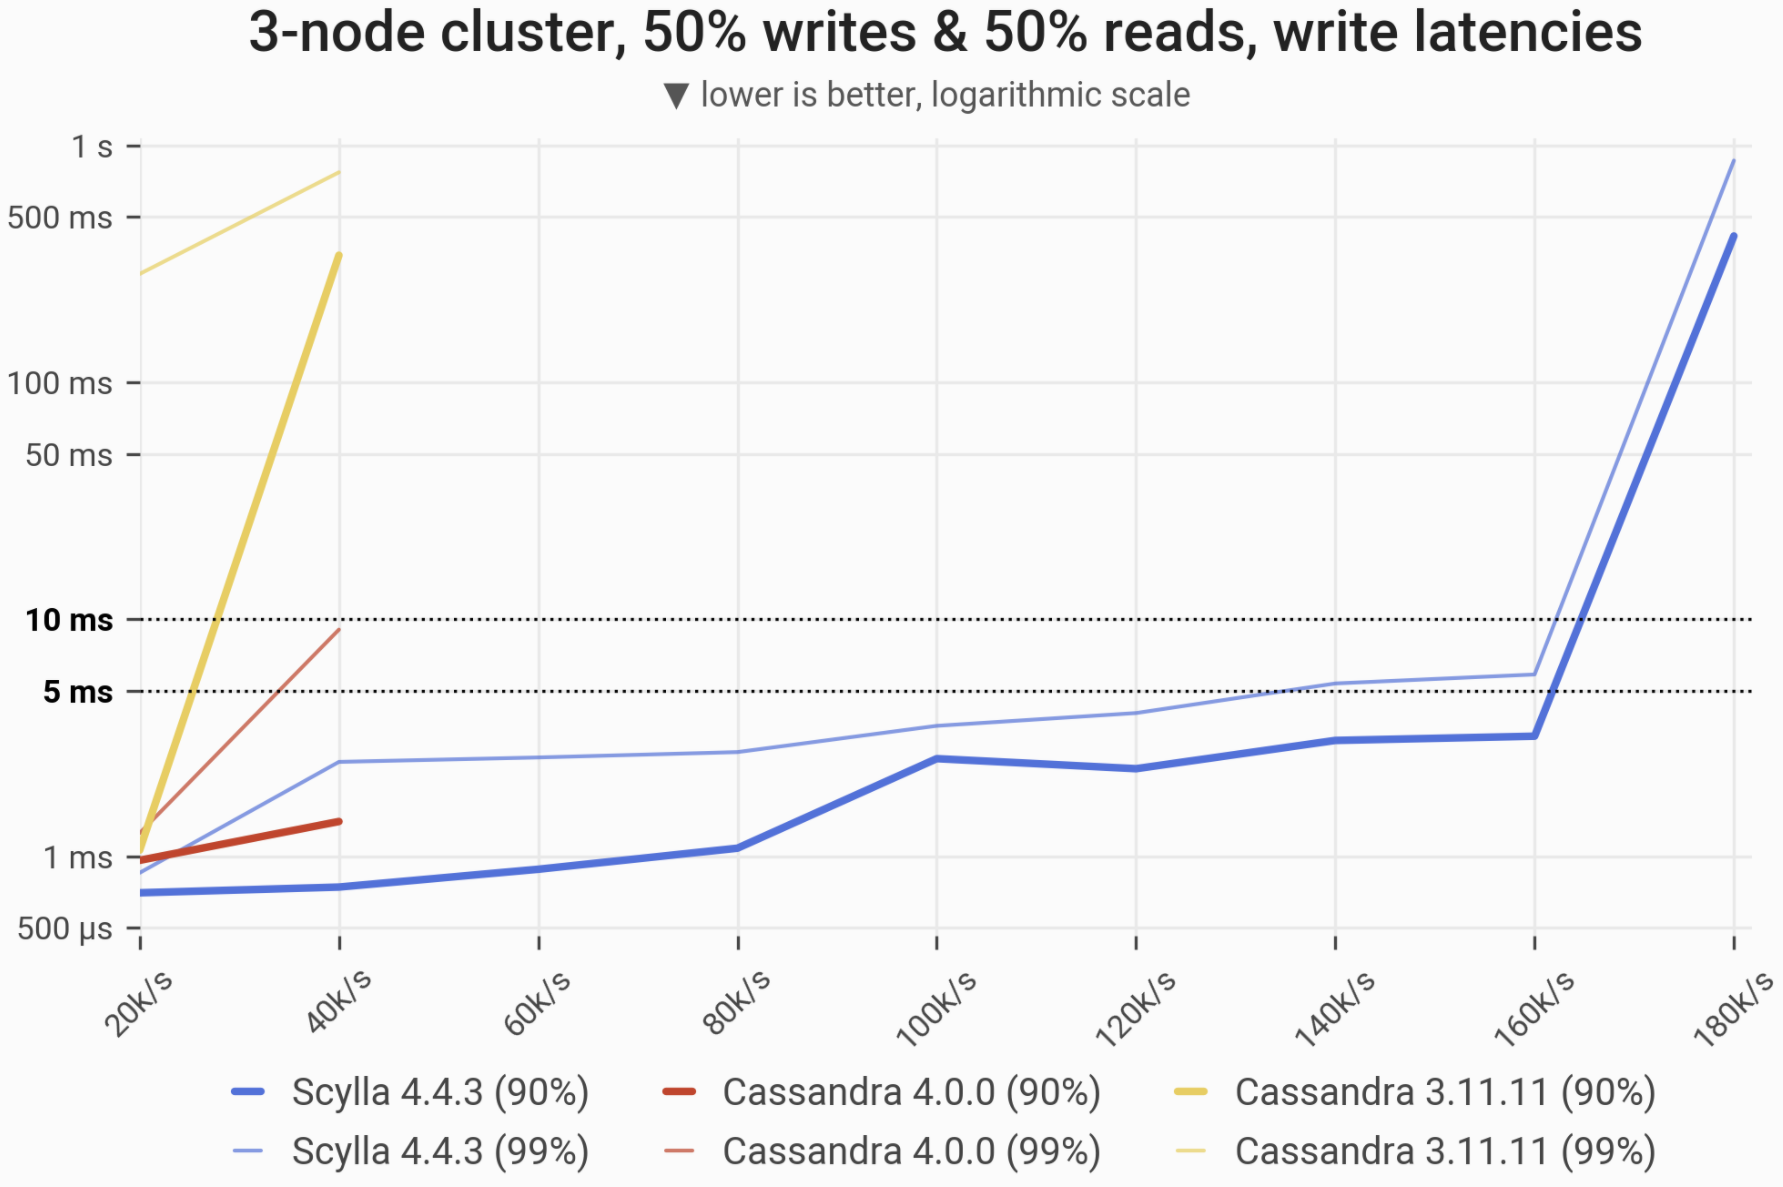
The 90- and 99-percentile latencies of UPDATE queries, as measured on three i3.4xlarge machines (48 vCPUs in total) in a range of load rates. Workload consists of 50% reads and 50% writes, randomly targeting a “realistic” Gaussian distribution. C*3 quickly becomes nonoperational, C*4 is a little better, meanwhile Scylla maintains low and consistent write latencies in the entire range.
| Metric |
Scylla 4.4.3 |
Cassandra 4.0 |
Cassandra 3.11 |
Cassandra 4.0 vs. Cassandra 3.11 |
Scylla 4.4.3 vs. Cassandra 4.0 |
| Maximum throughput |
80k/s |
40k/s |
30k/s |
1.33x |
2x |
| Maximum throughput with 90% latency <10ms |
80k/s |
30k/s |
10k/s |
3x |
2.66x |
| Maximum throughput with 99% latency <10ms |
80k/s |
30k/s |
– |
– |
2.66x |
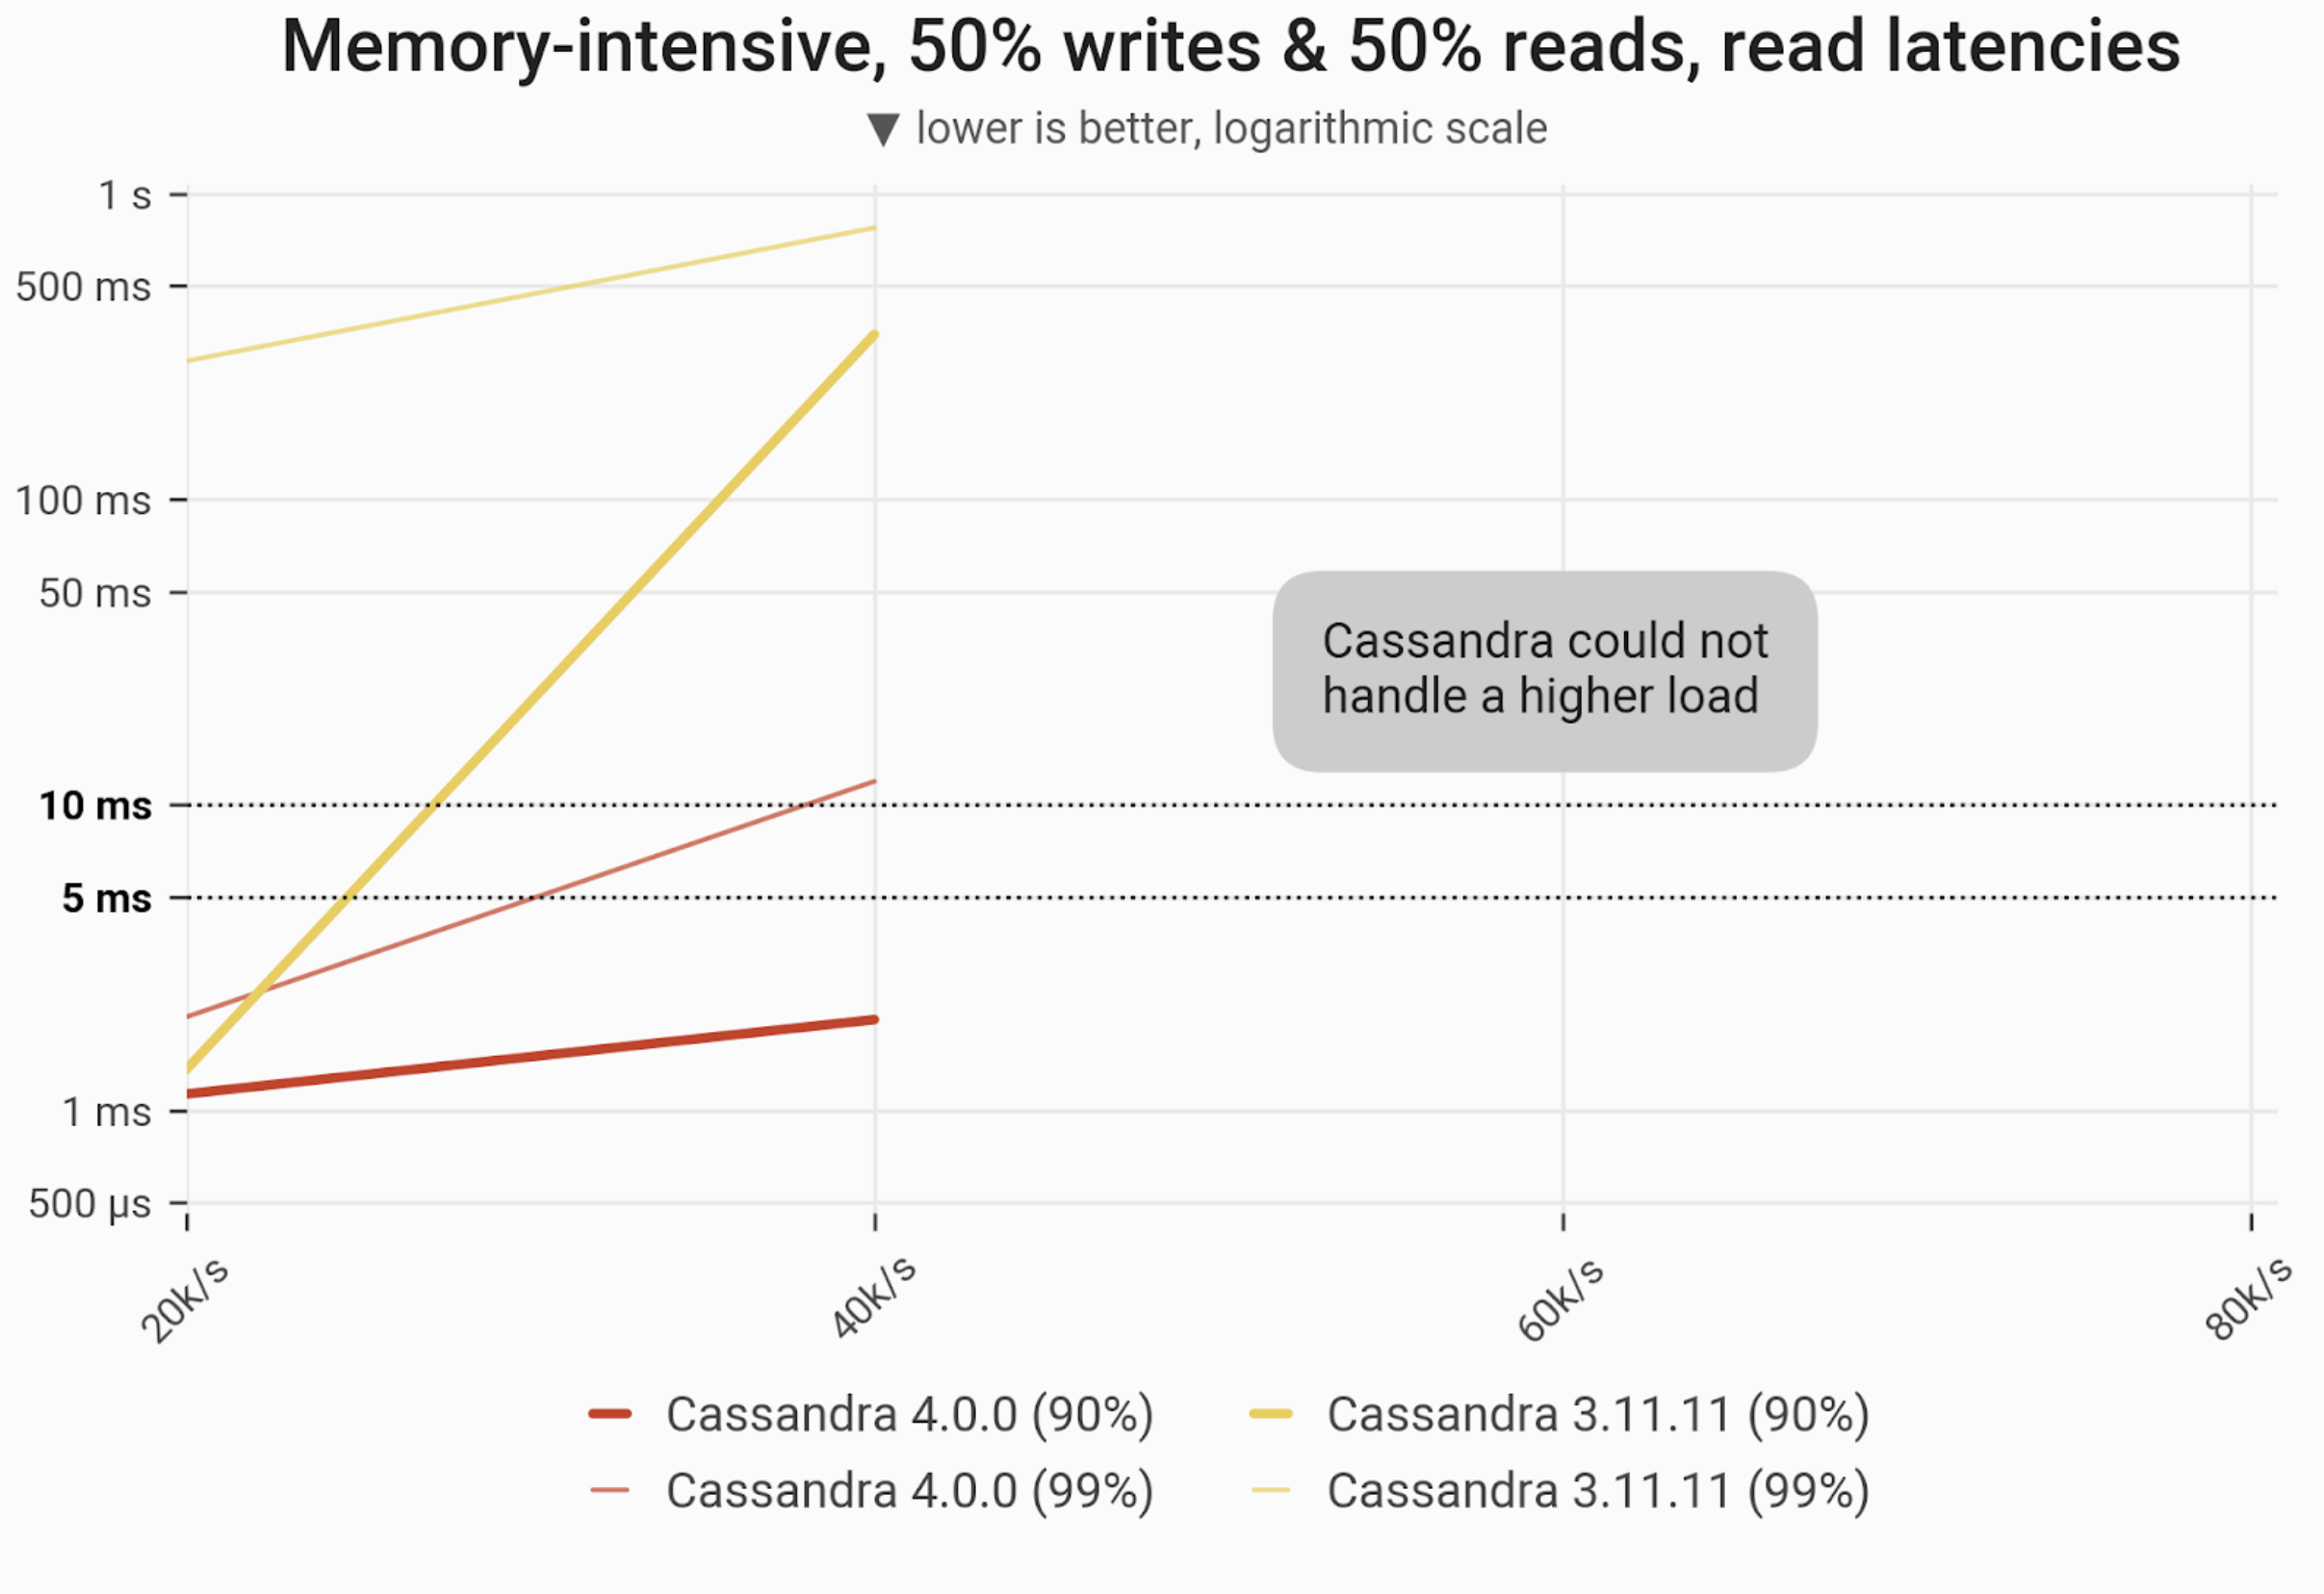
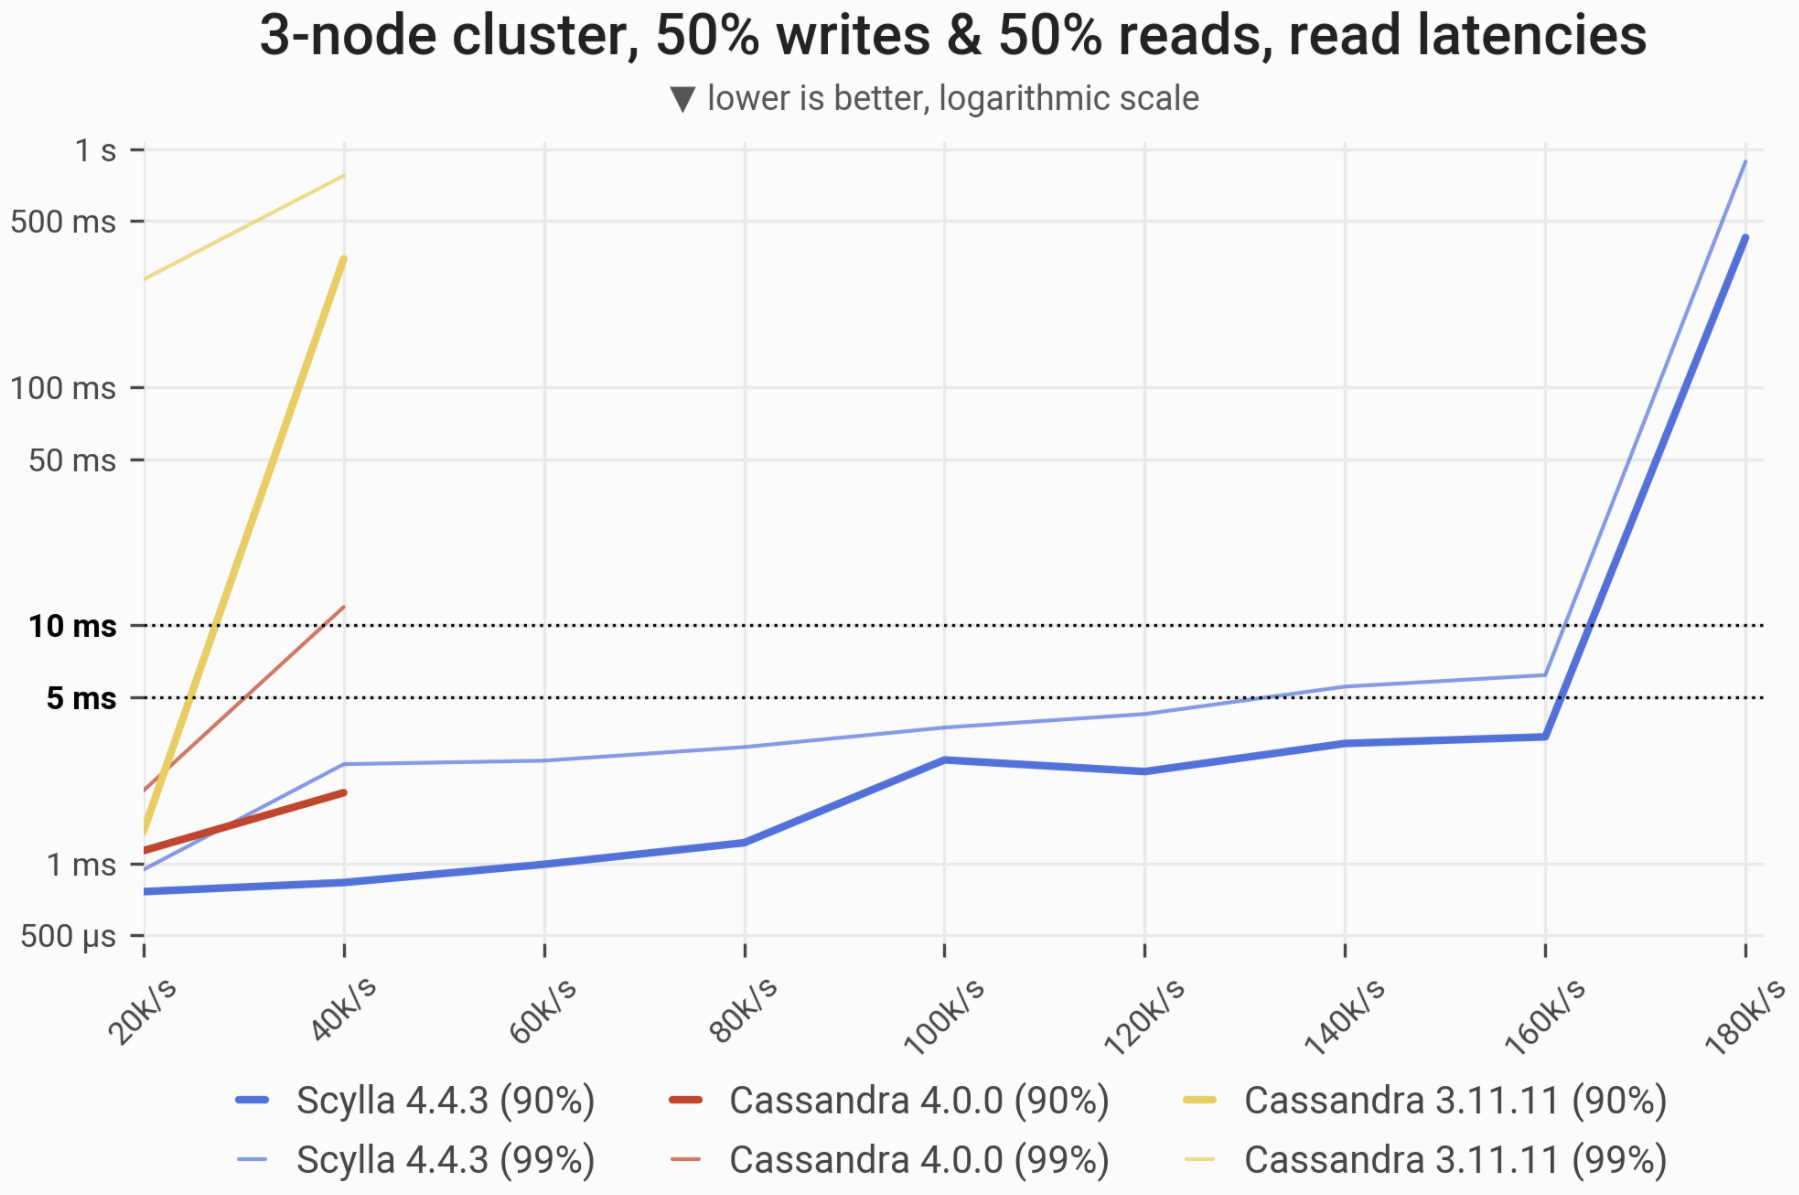
![]()
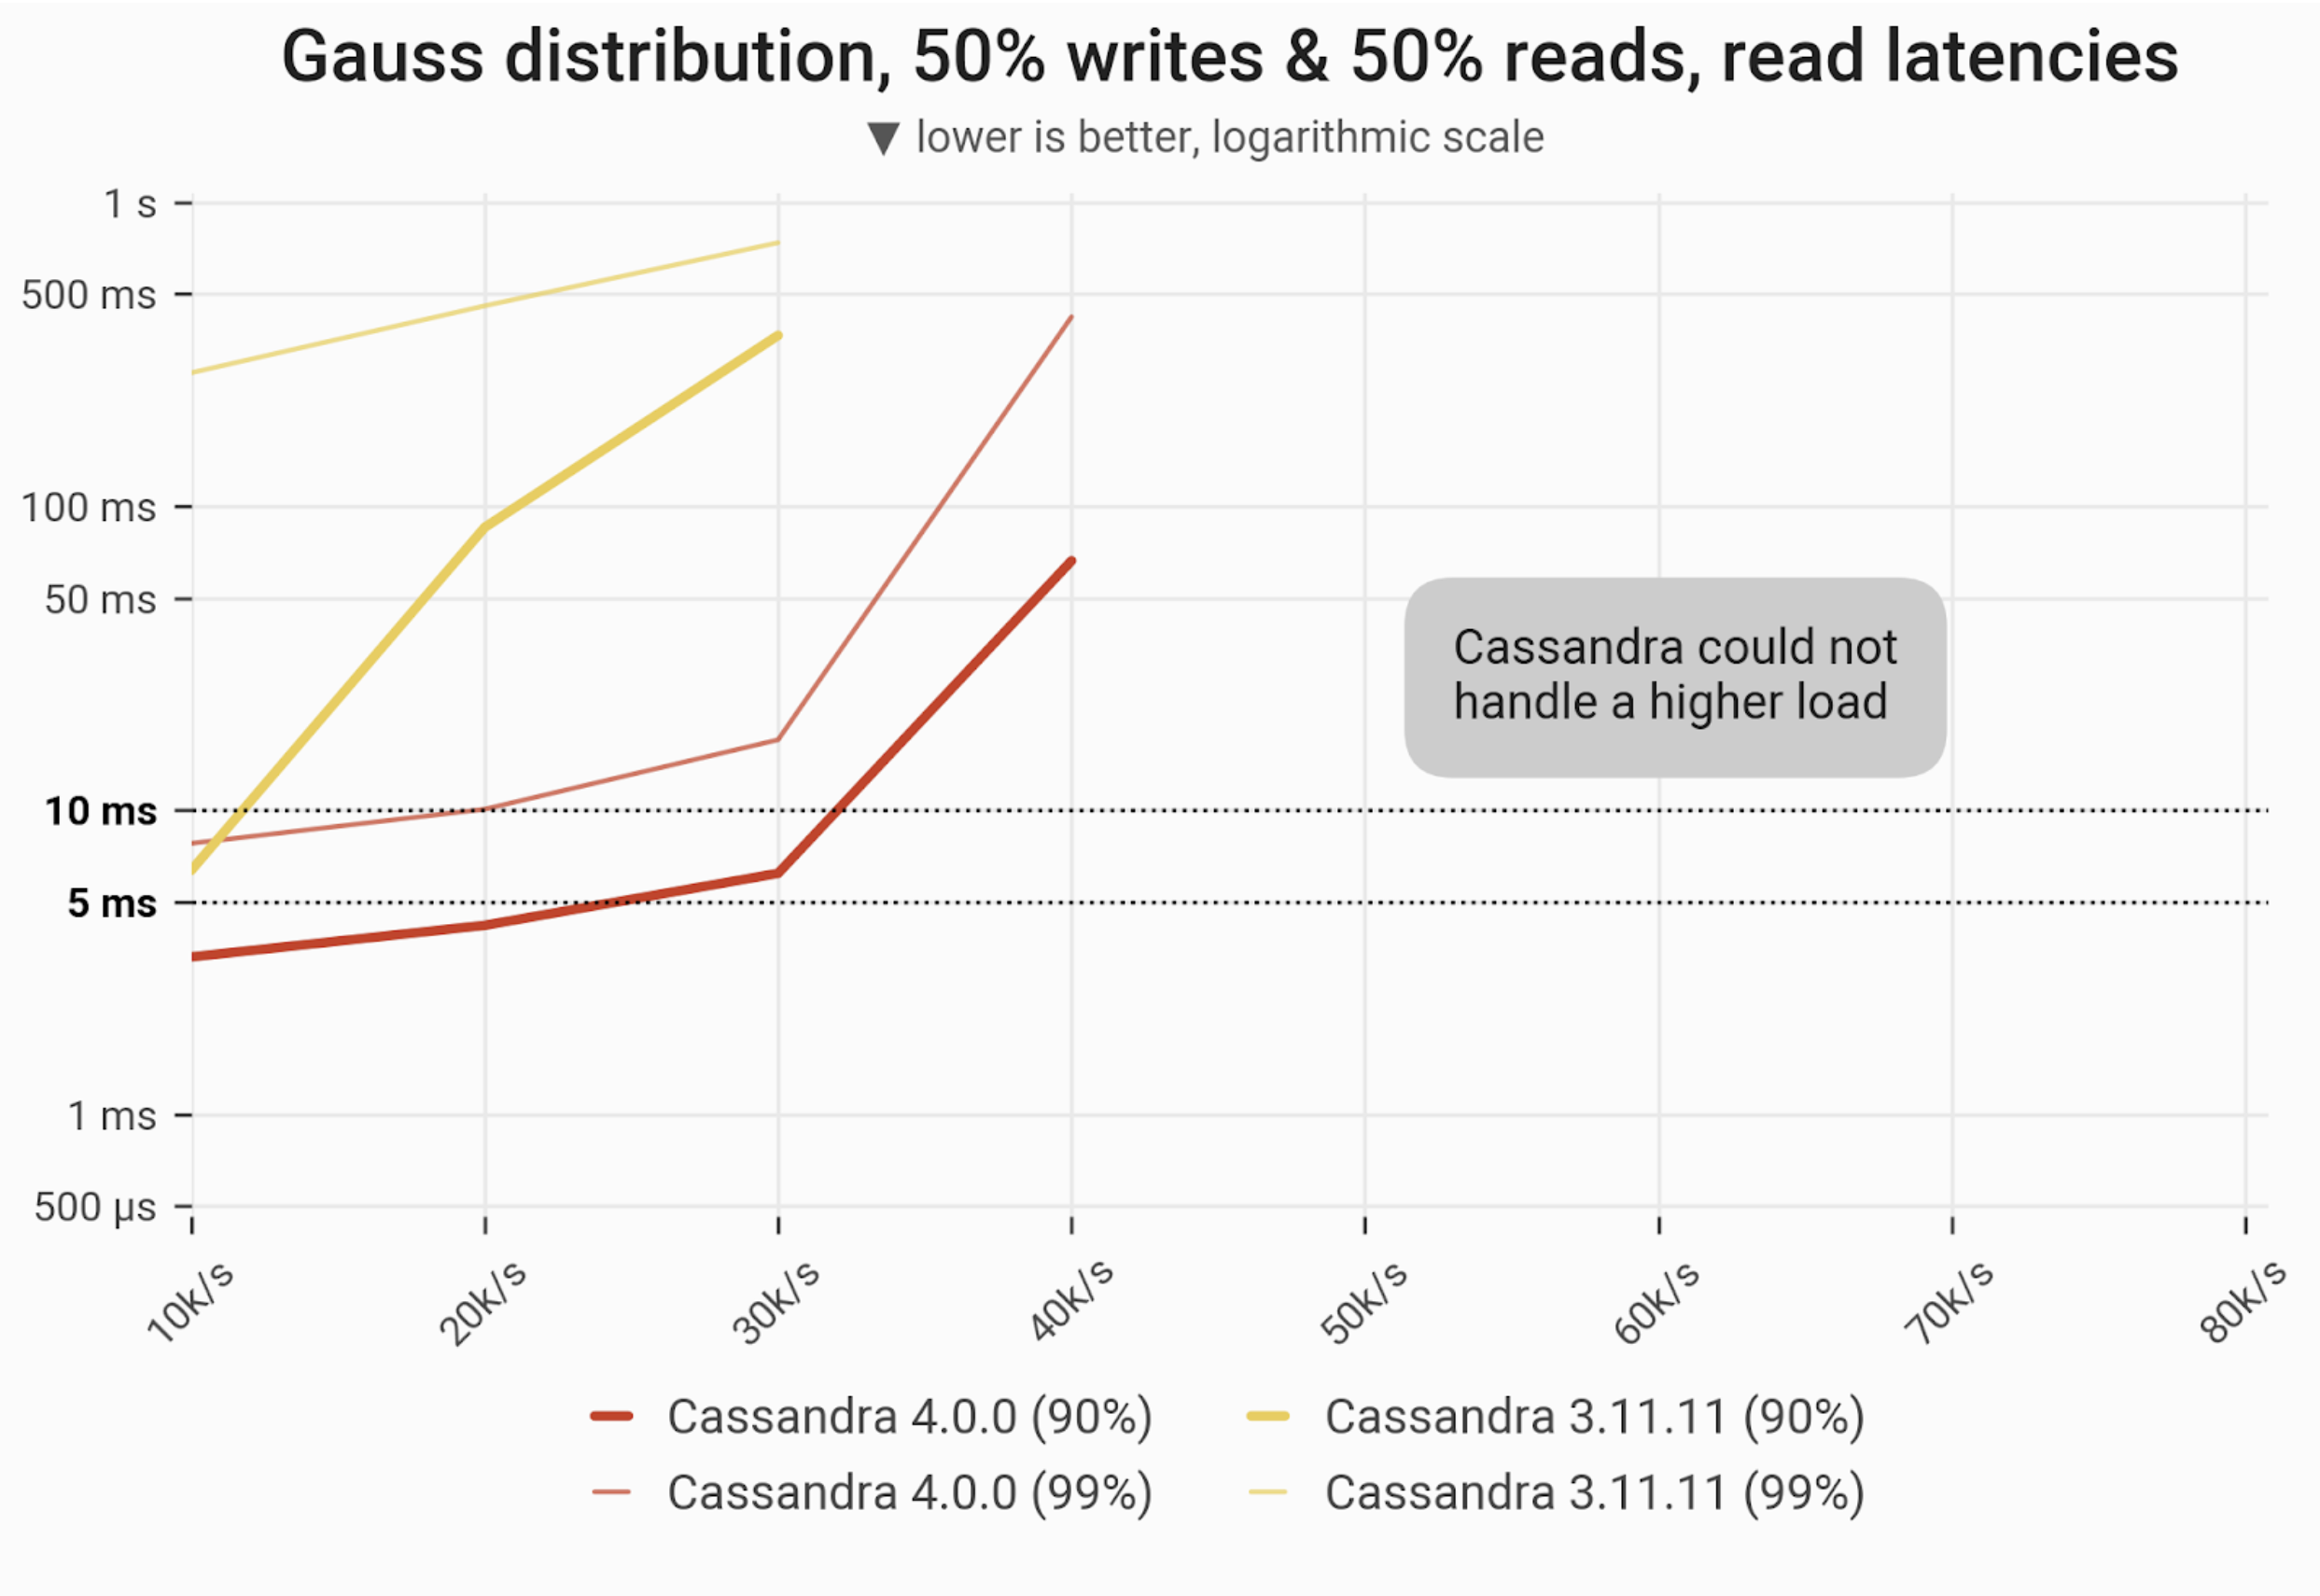
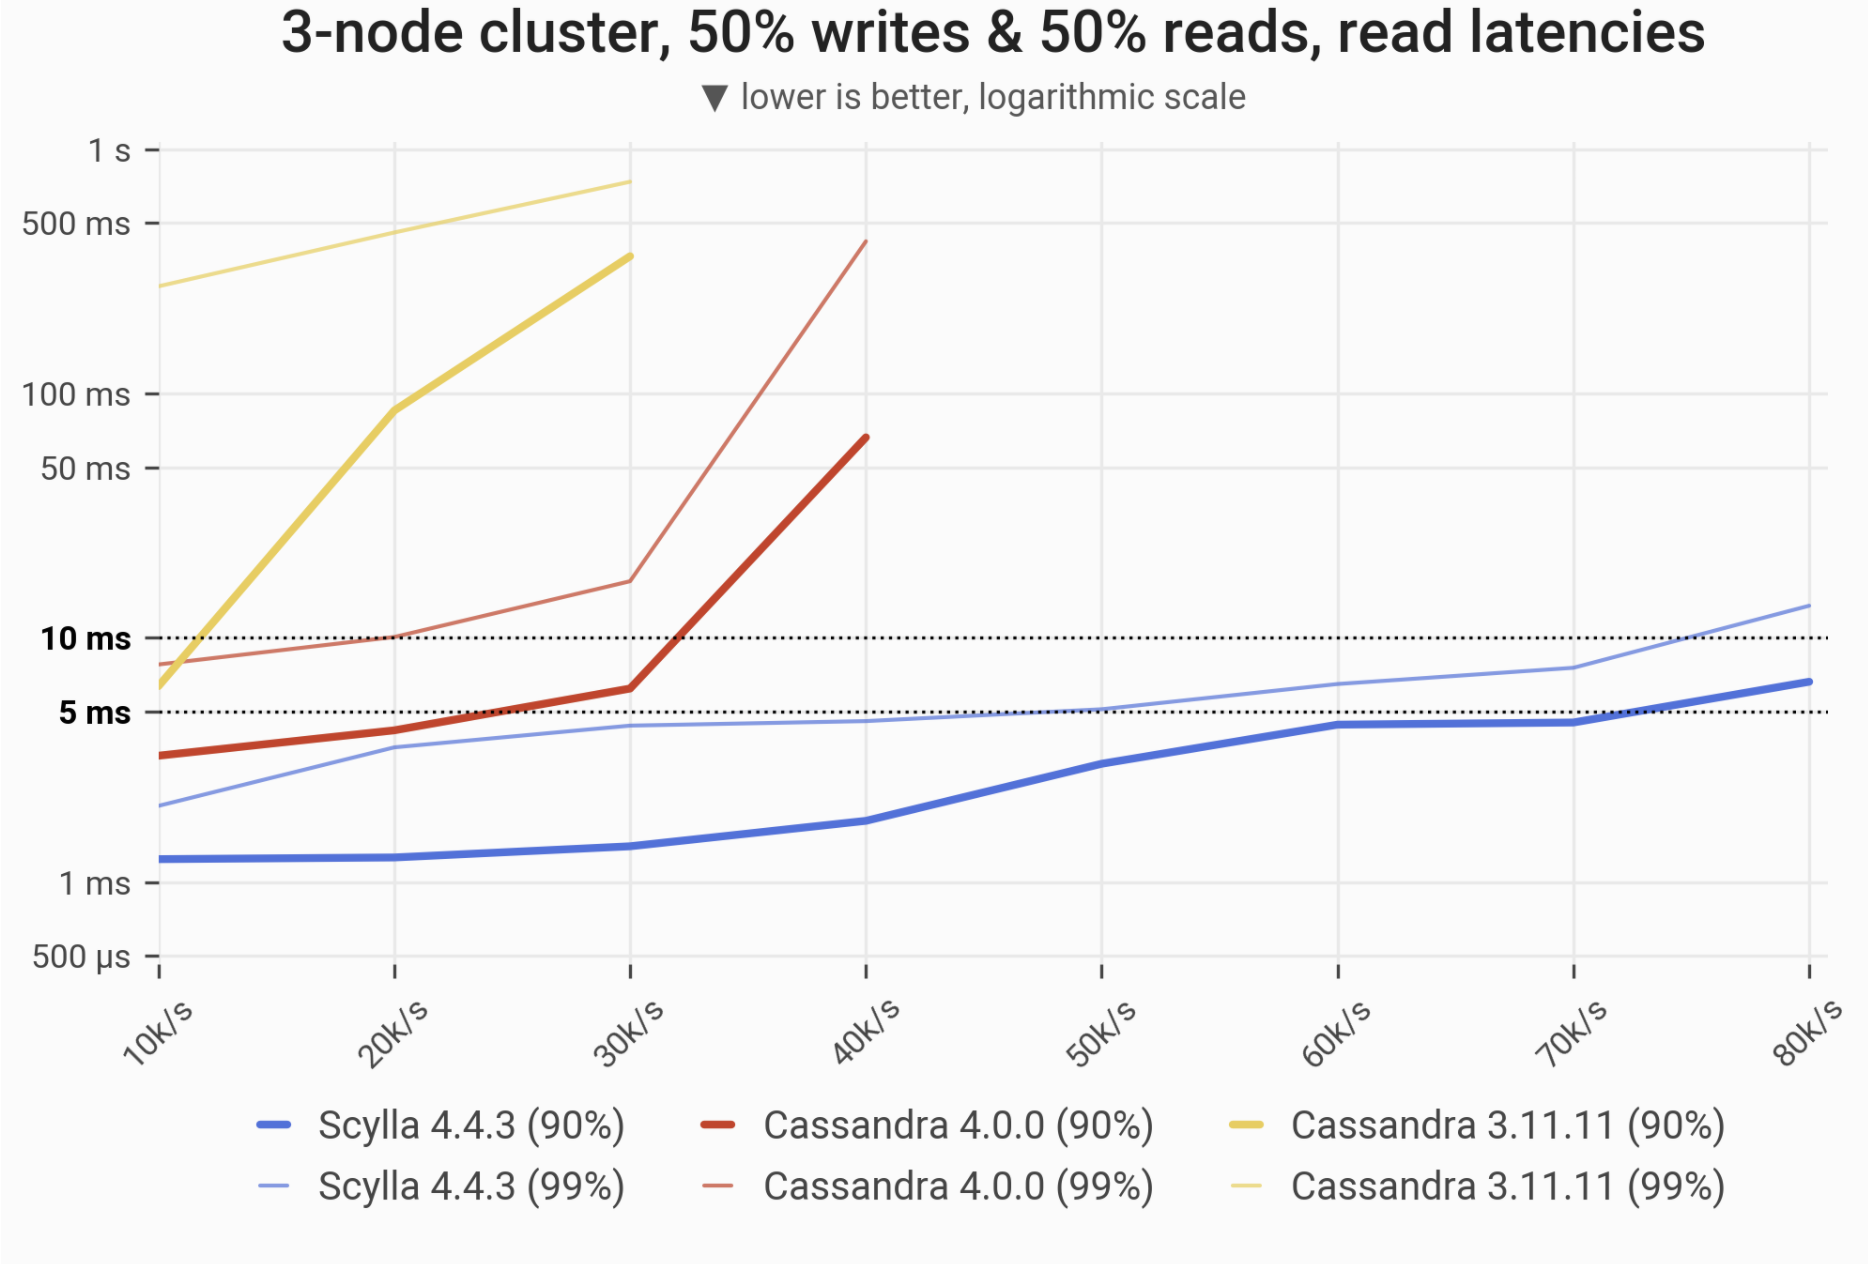
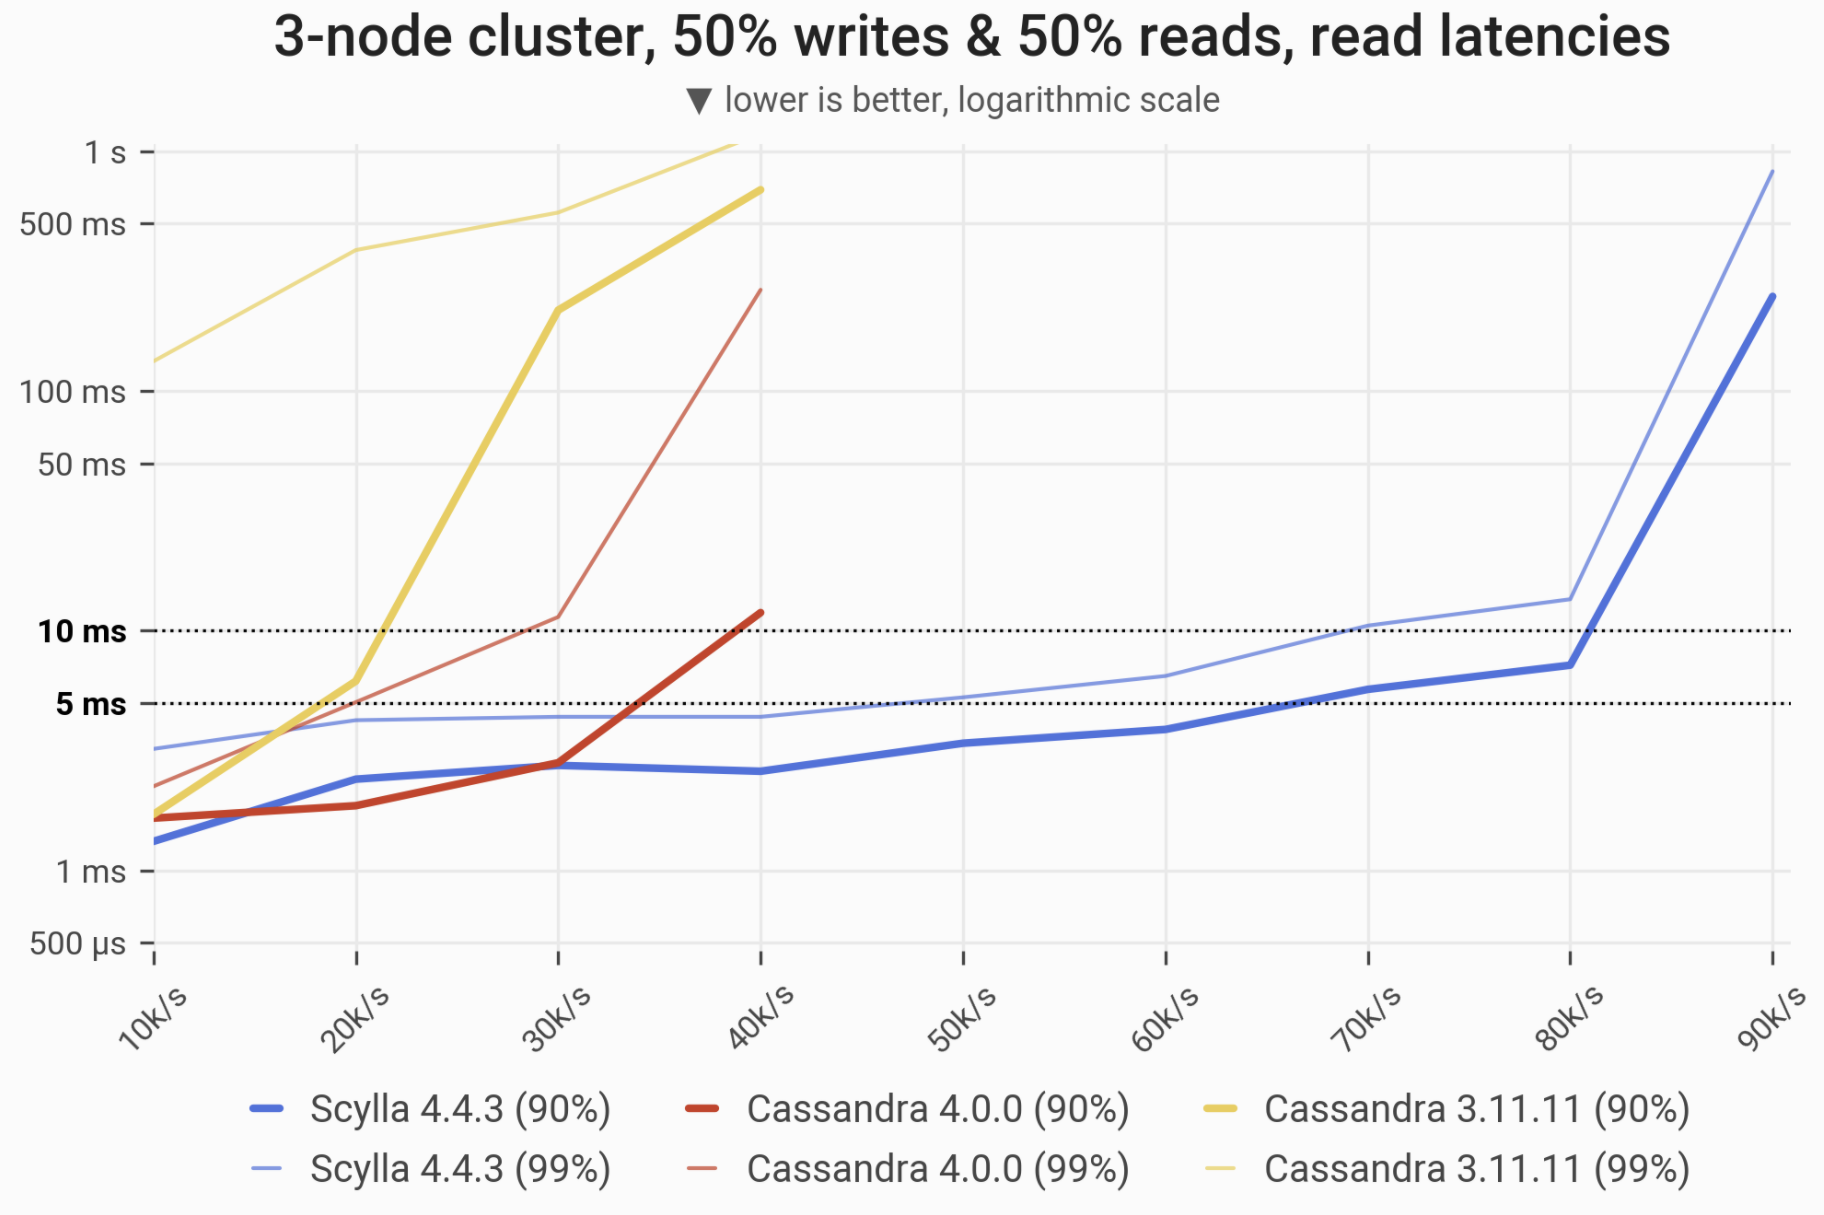
The 90- and 99-percentile latencies of SELECT queries, as measured on three i3.4xlarge machines (48 vCPUs in total) in a range of load rates. Workload consists of 50% reads and 50% writes, randomly targeting a “realistic” Gaussian distribution. C*3 quickly becomes nonoperational, C*4 is a little better; meanwhile Scylla maintains low and consistent response times in the entire range.
| Metric |
Scylla 4.4.3 |
Cassandra 4.0 |
Cassandra 3.11 |
Cassandra 4.0 vs. Cassandra 3.11 |
Scylla 4.4.3 vs. Cassandra 4.0 |
| Maximum throughput |
90k/s |
40k/s |
40k/s |
1x |
2.25x |
| Maximum throughput with 90% latency <10ms |
80k/s |
30k/s |
10k/s |
3x |
2.66x |
| Maximum throughput with 99% latency <10ms |
70k/s |
10k/s |
– |
– |
7x |
Uniform Distribution (disk-intensive, low cache hit ratio)
In this scenario we issue queries that touch random partitions of the entire dataset. In our setup this should result in high disk traffic and/or negligible cache hit rates, i.e. that of a few %.
Writes Workload – Only Writes
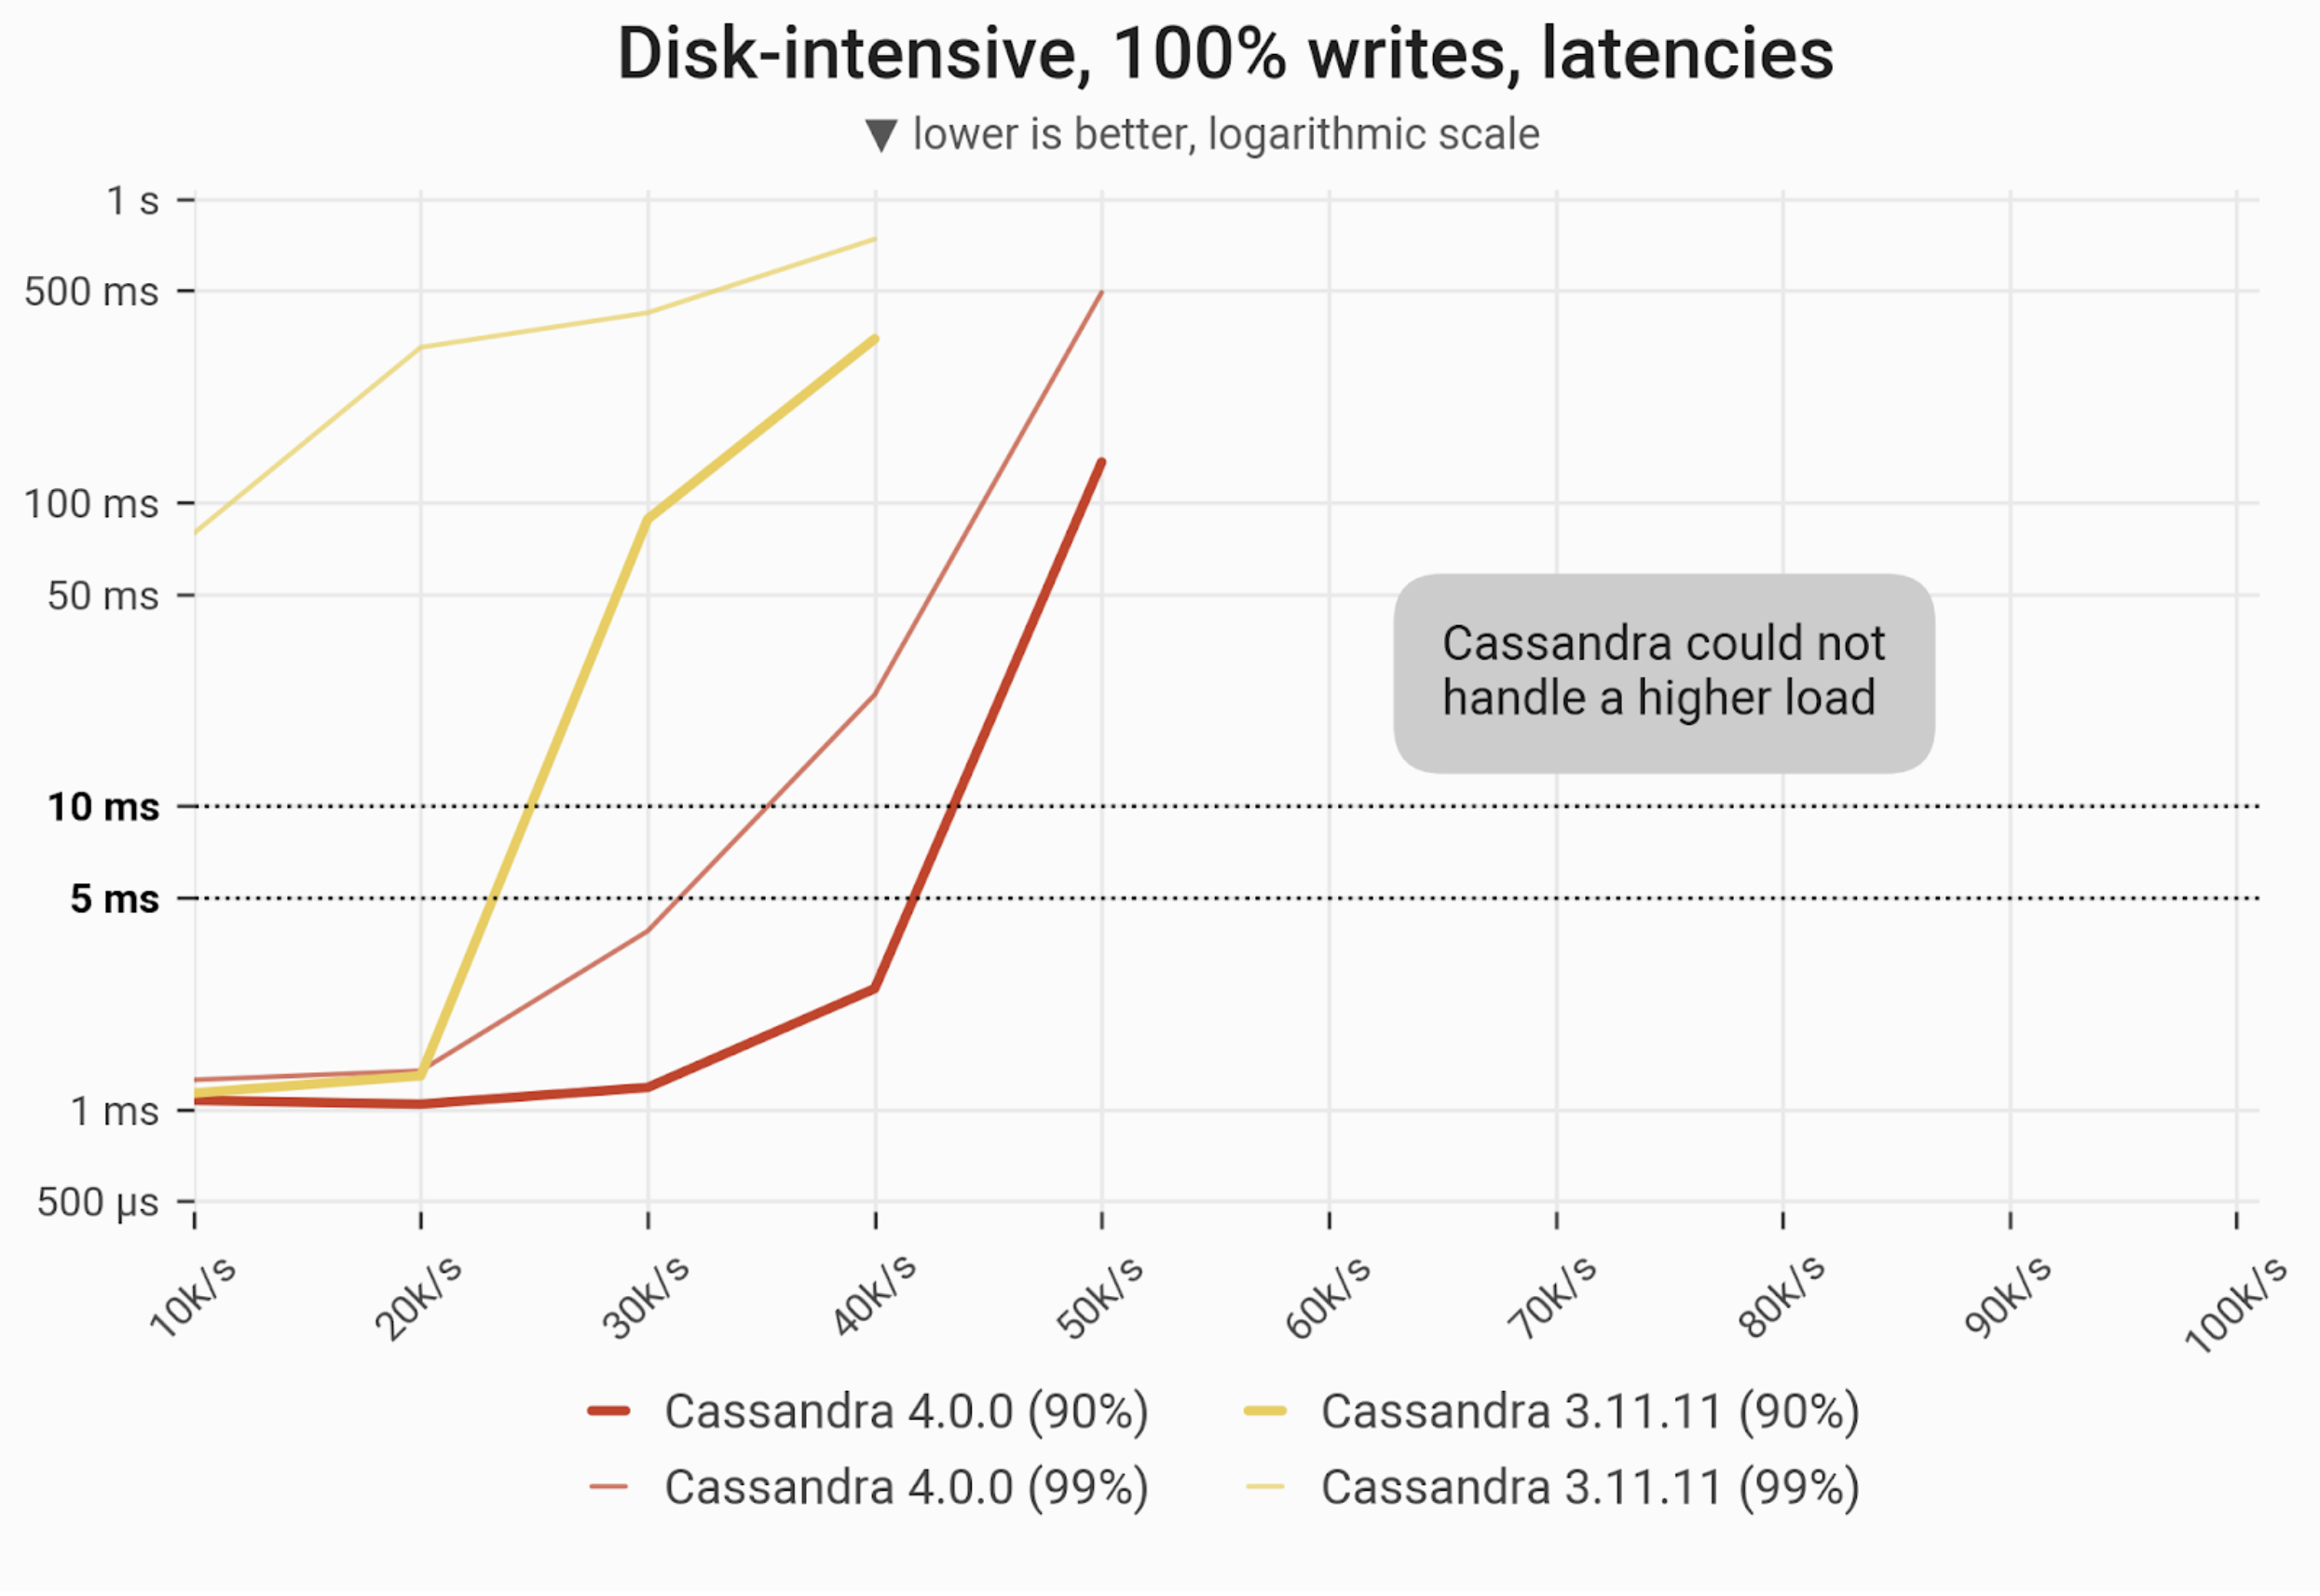
![]()
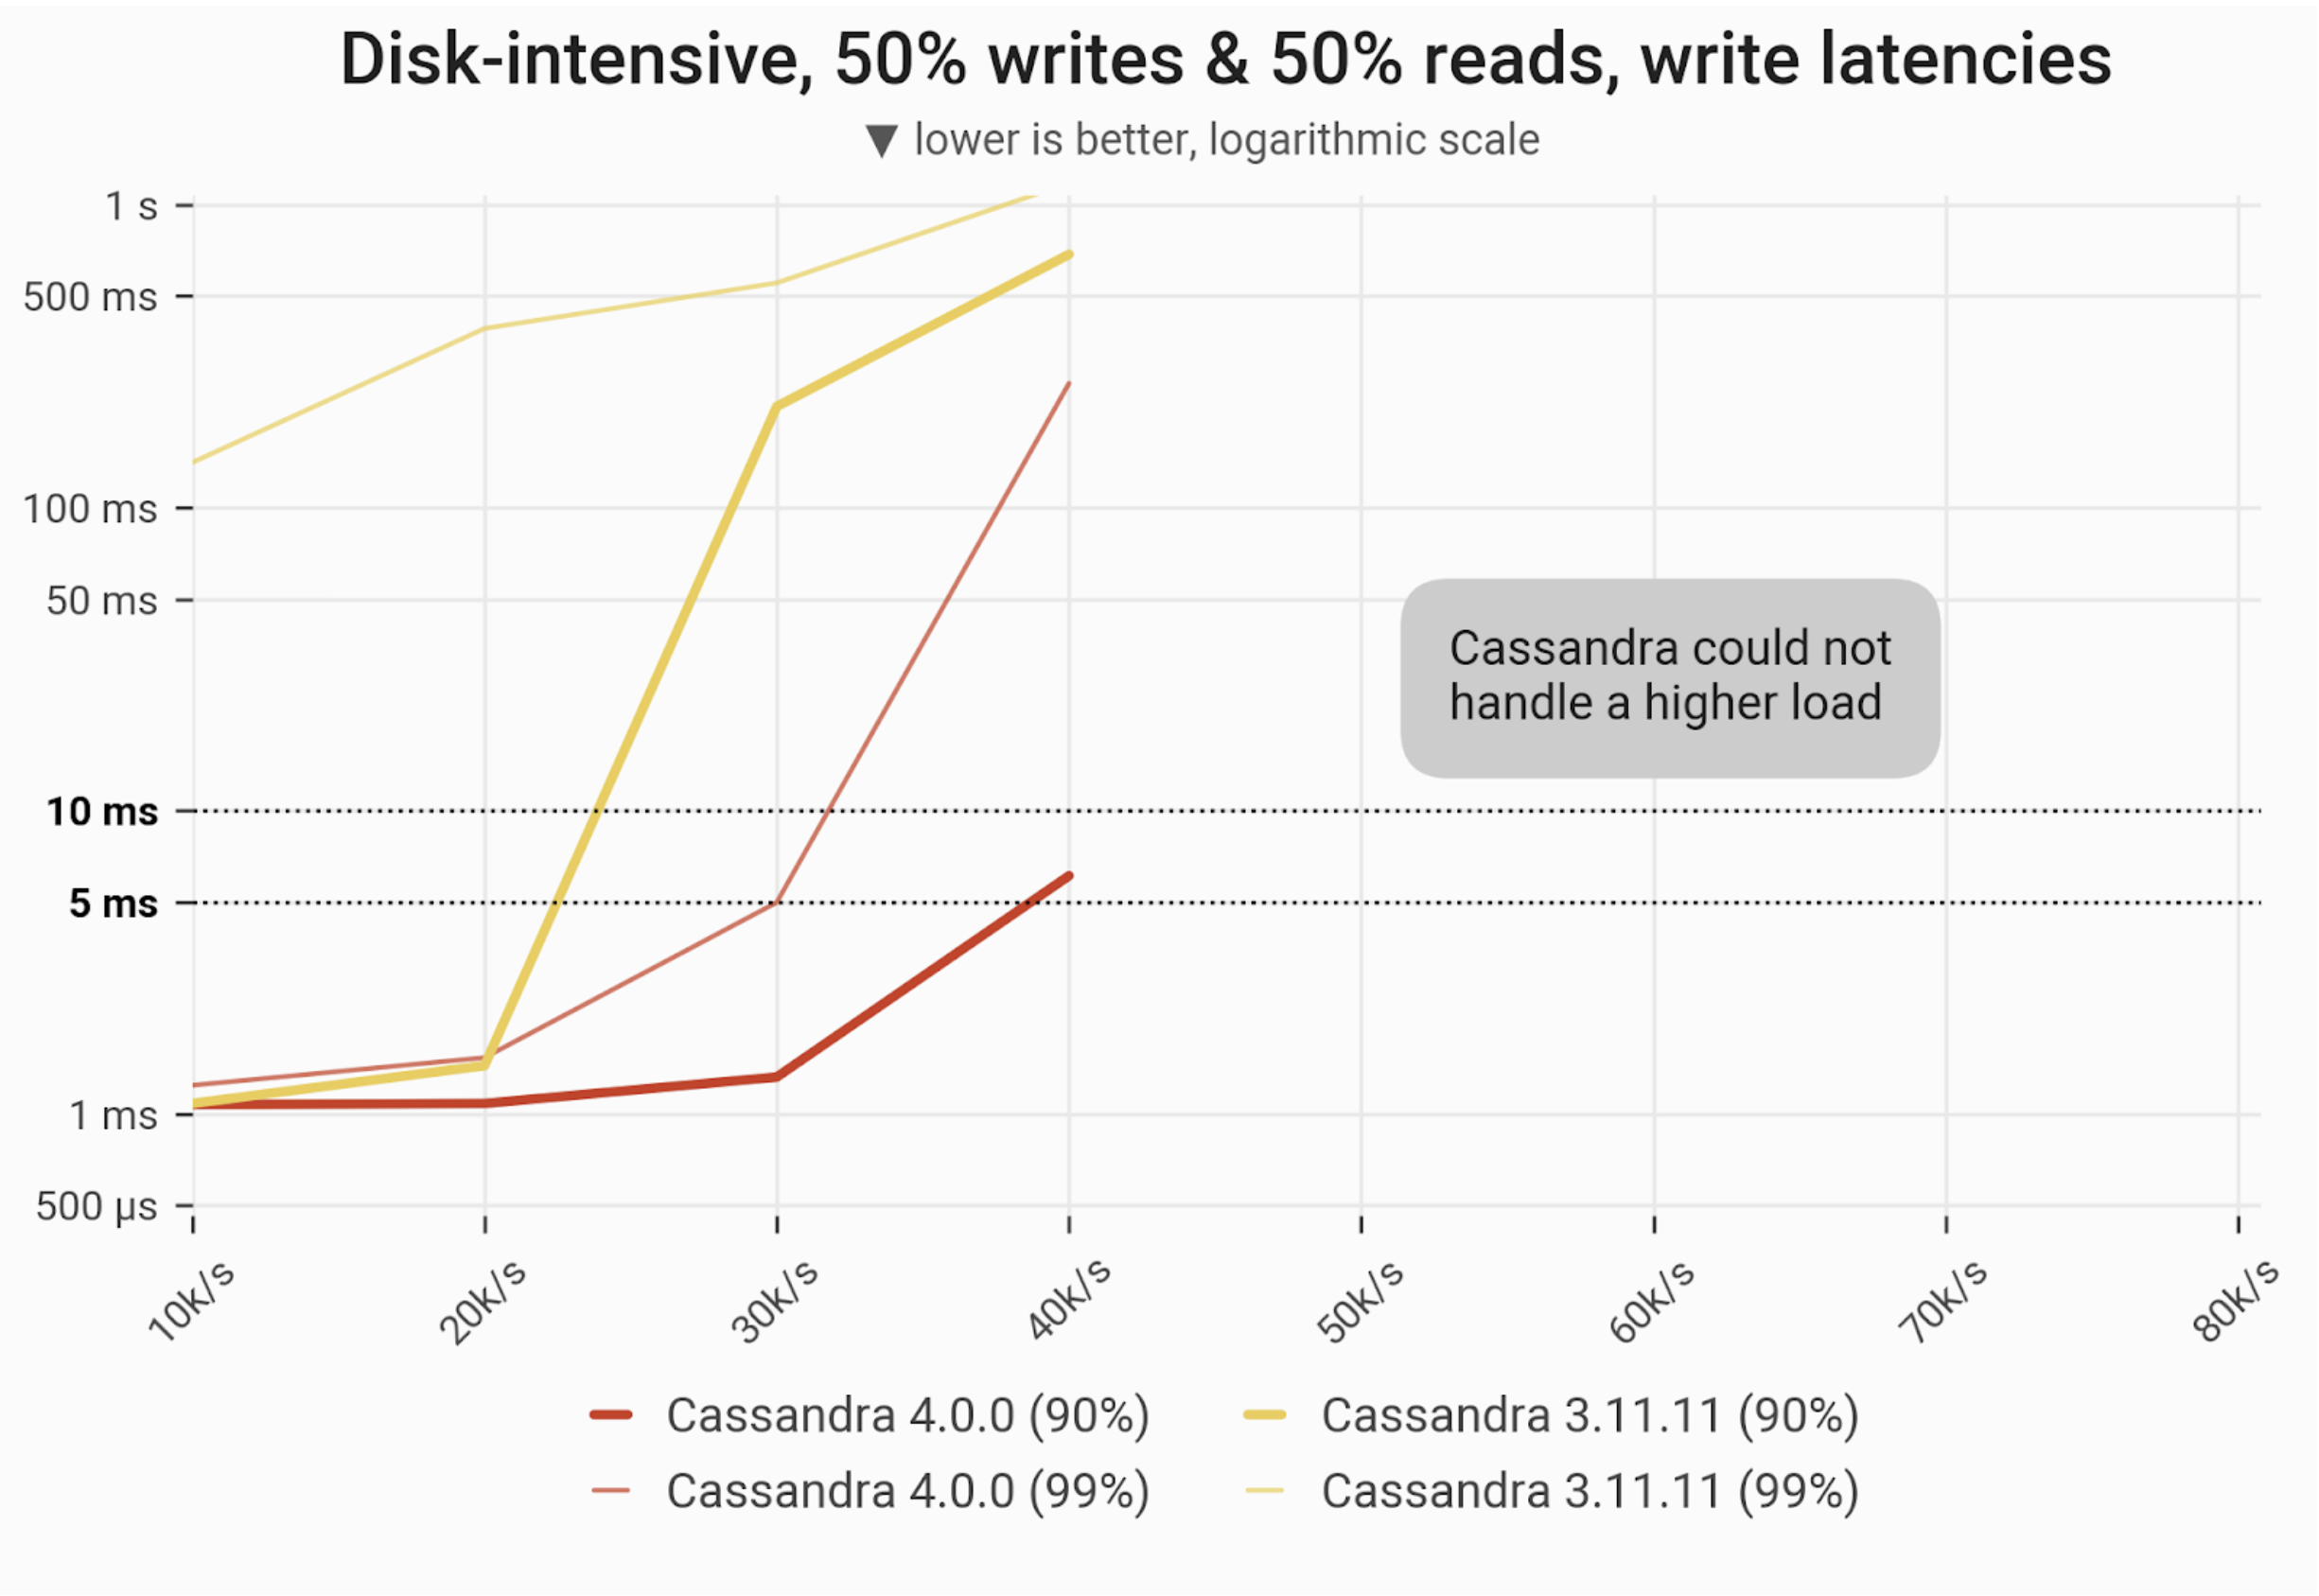
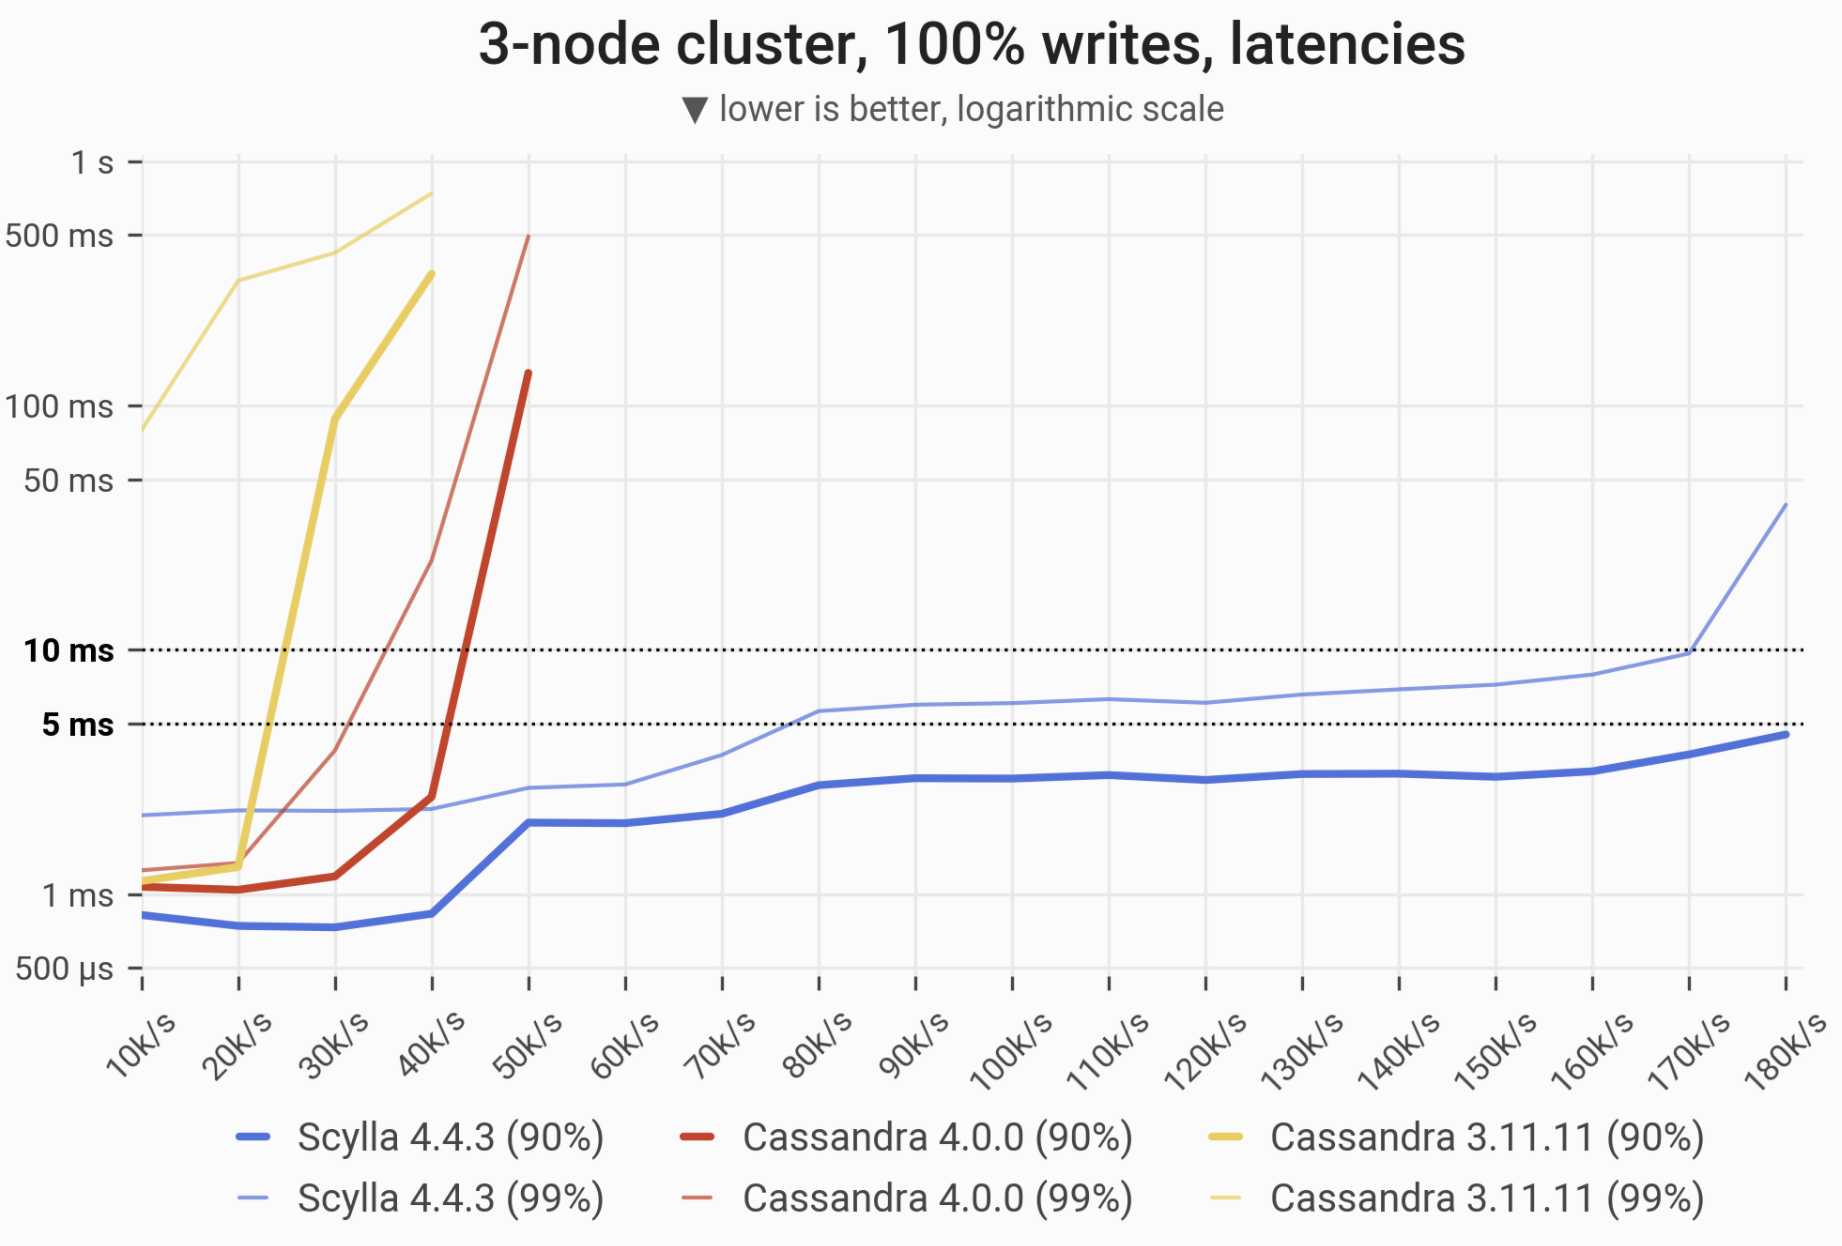
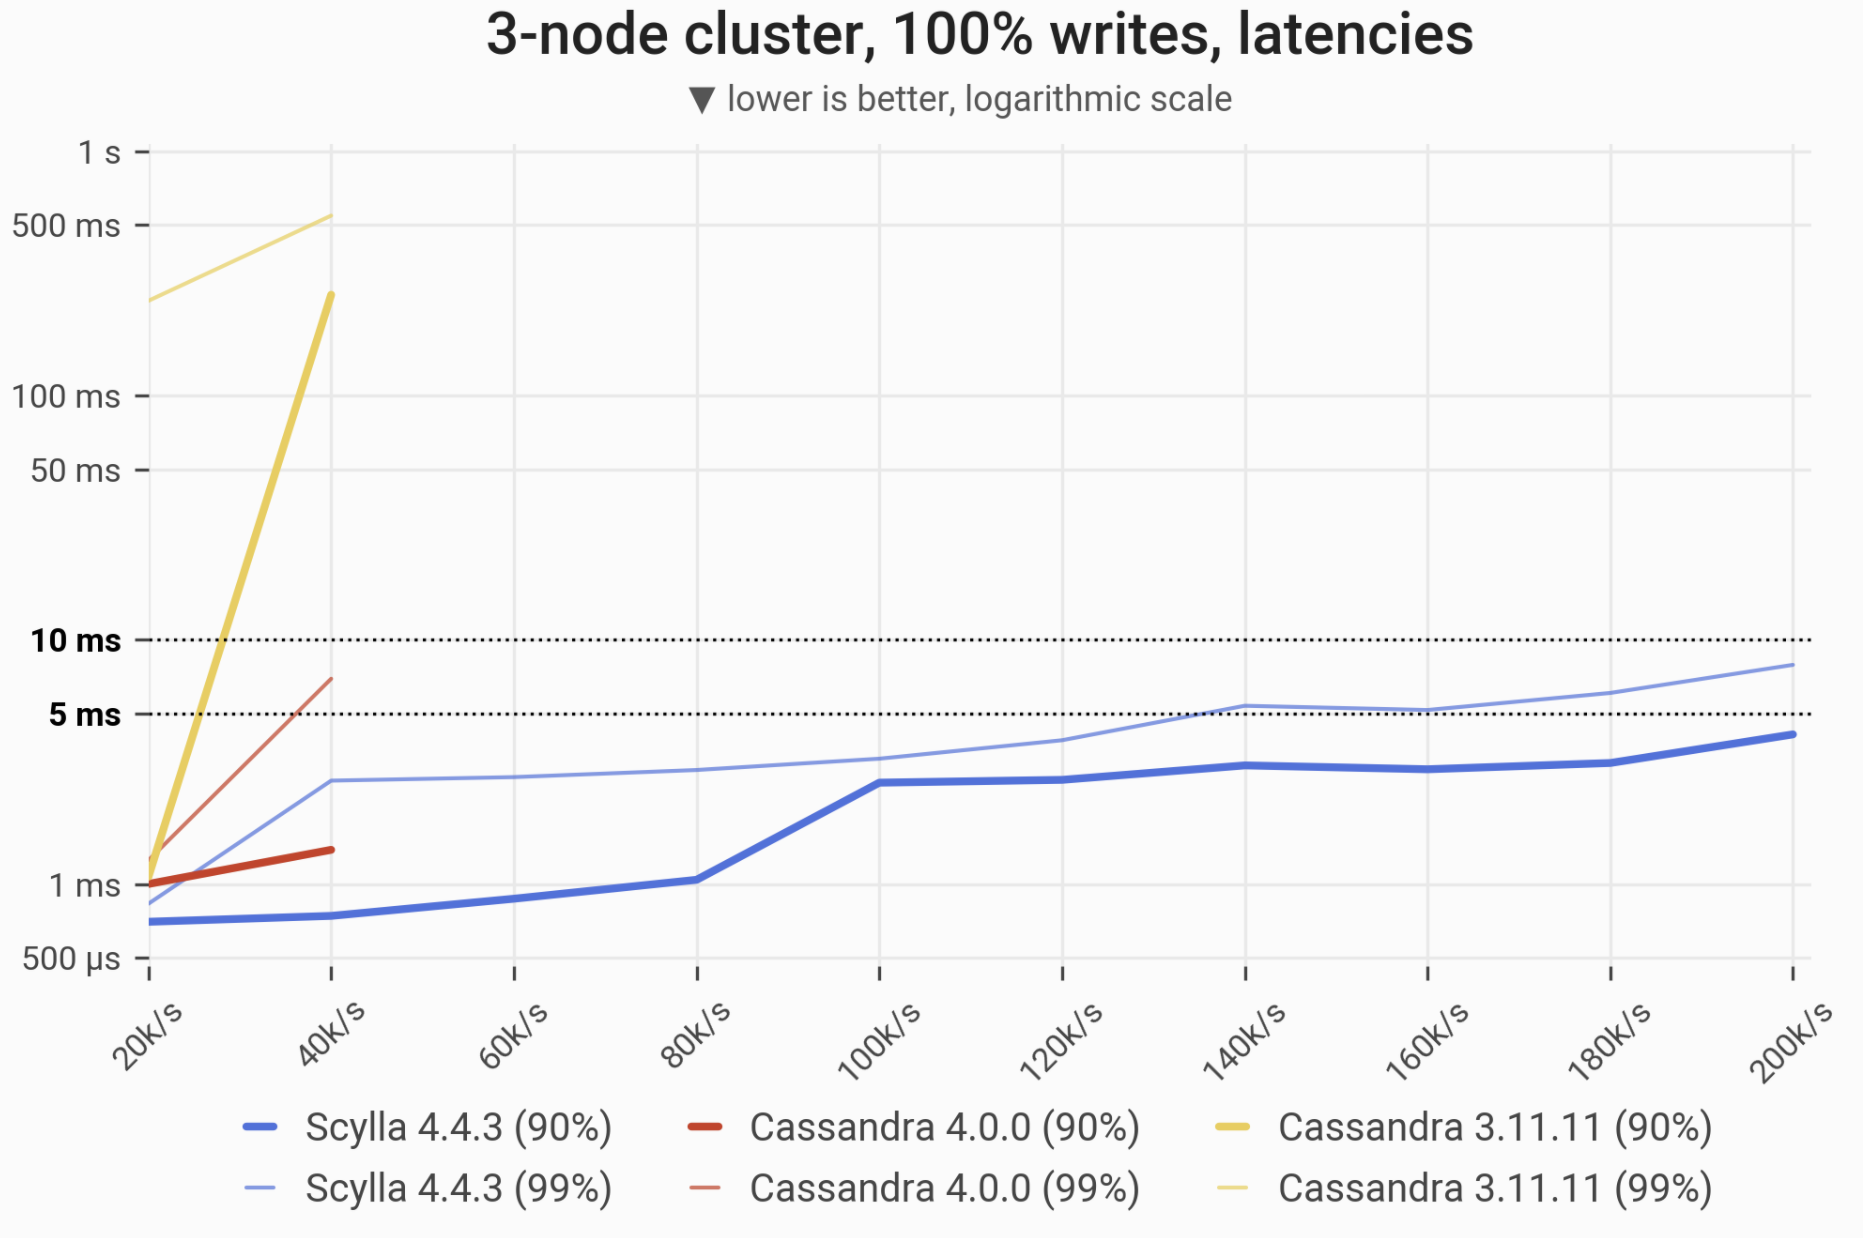
The 90- and 99-percentile latencies of UPDATE queries, as measured on three i3.4xlarge machines (48 vCPUs in total) in a range of load rates. Workload is uniformly distributed, i.e. every partition in the 1 TB dataset has an equal chance of being updated. C*3 quickly becomes nonoperational, C*4 is a little better; meanwhile Scylla maintains low and consistent write latencies up until 170,000-180,000 ops/s.
| Metric |
Scylla 4.4.3 |
Cassandra 4.0 |
Cassandra 3.11 |
Cassandra 4.0 vs. Cassandra 3.11 |
Scylla 4.4.3 vs. Cassandra 4.0 |
| Maximum throughput |
180k/s |
50k/s |
40k/s |
1.25x |
3.6x |
| Maximum throughput with 90% latency <10ms |
180k/s |
40k/s |
20k/s |
2x |
3.5x |
| Maximum throughput with 99% latency <10ms |
170k/s |
30k/s |
– |
– |
5.66x |
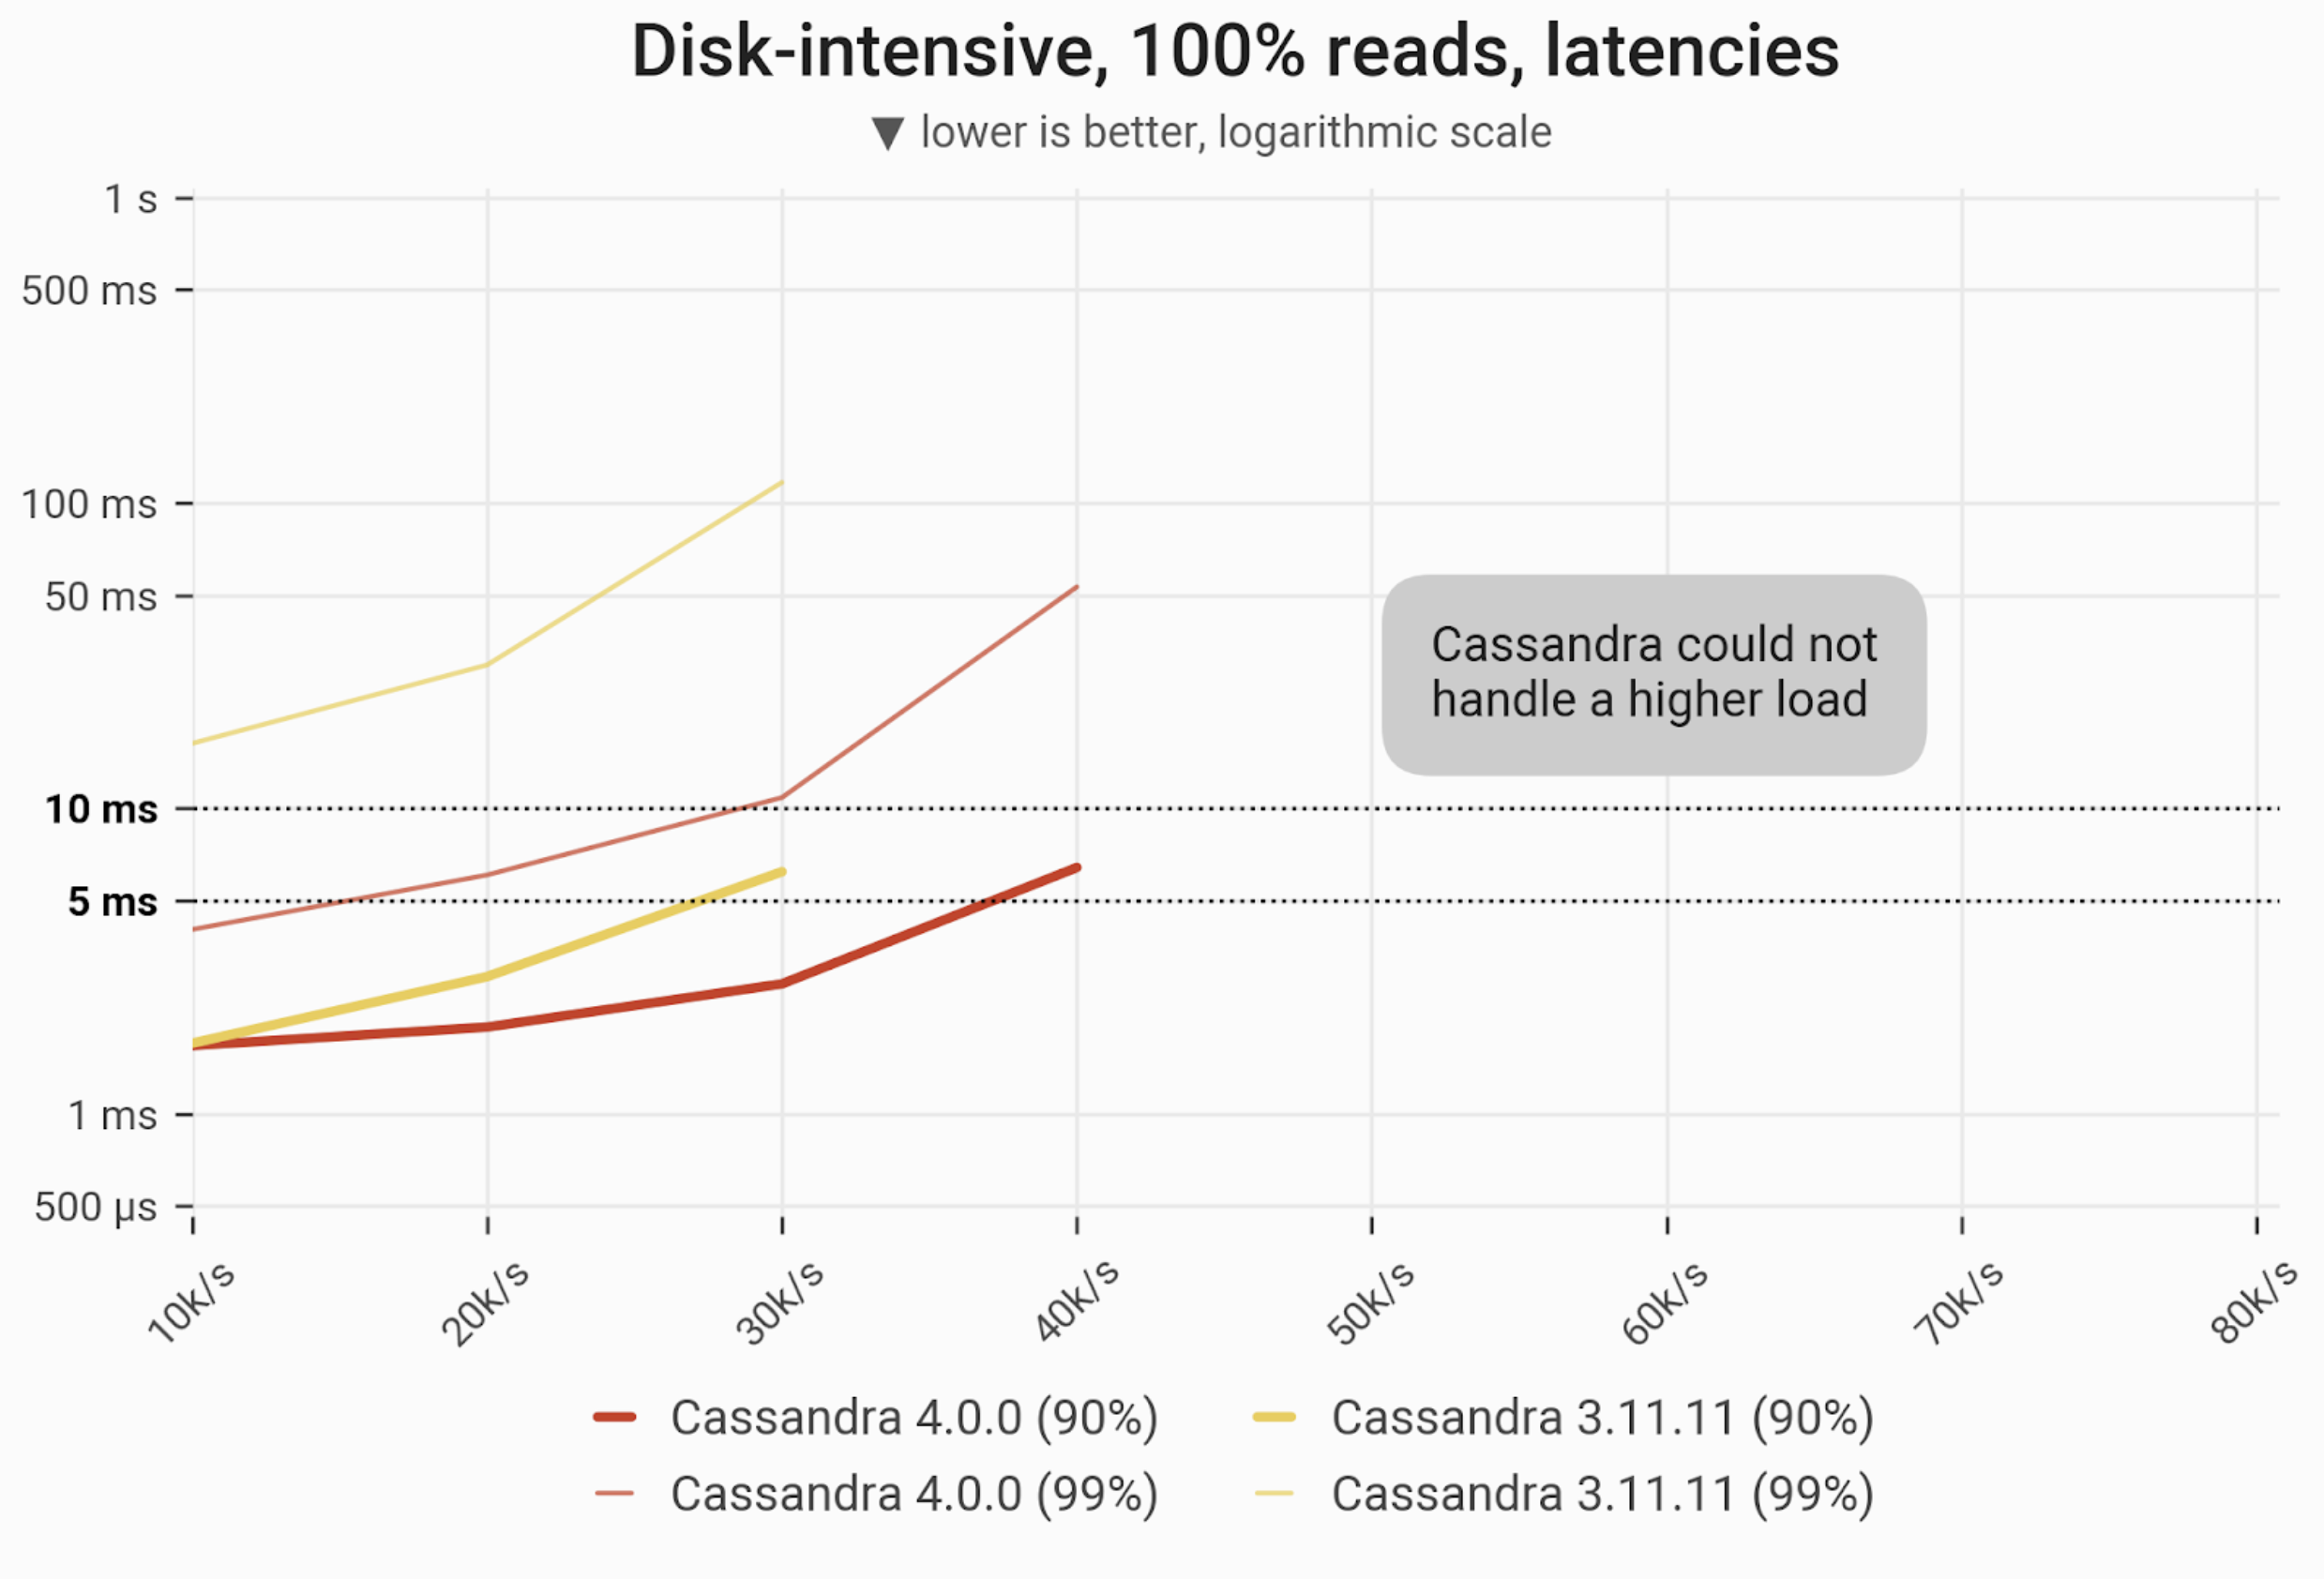
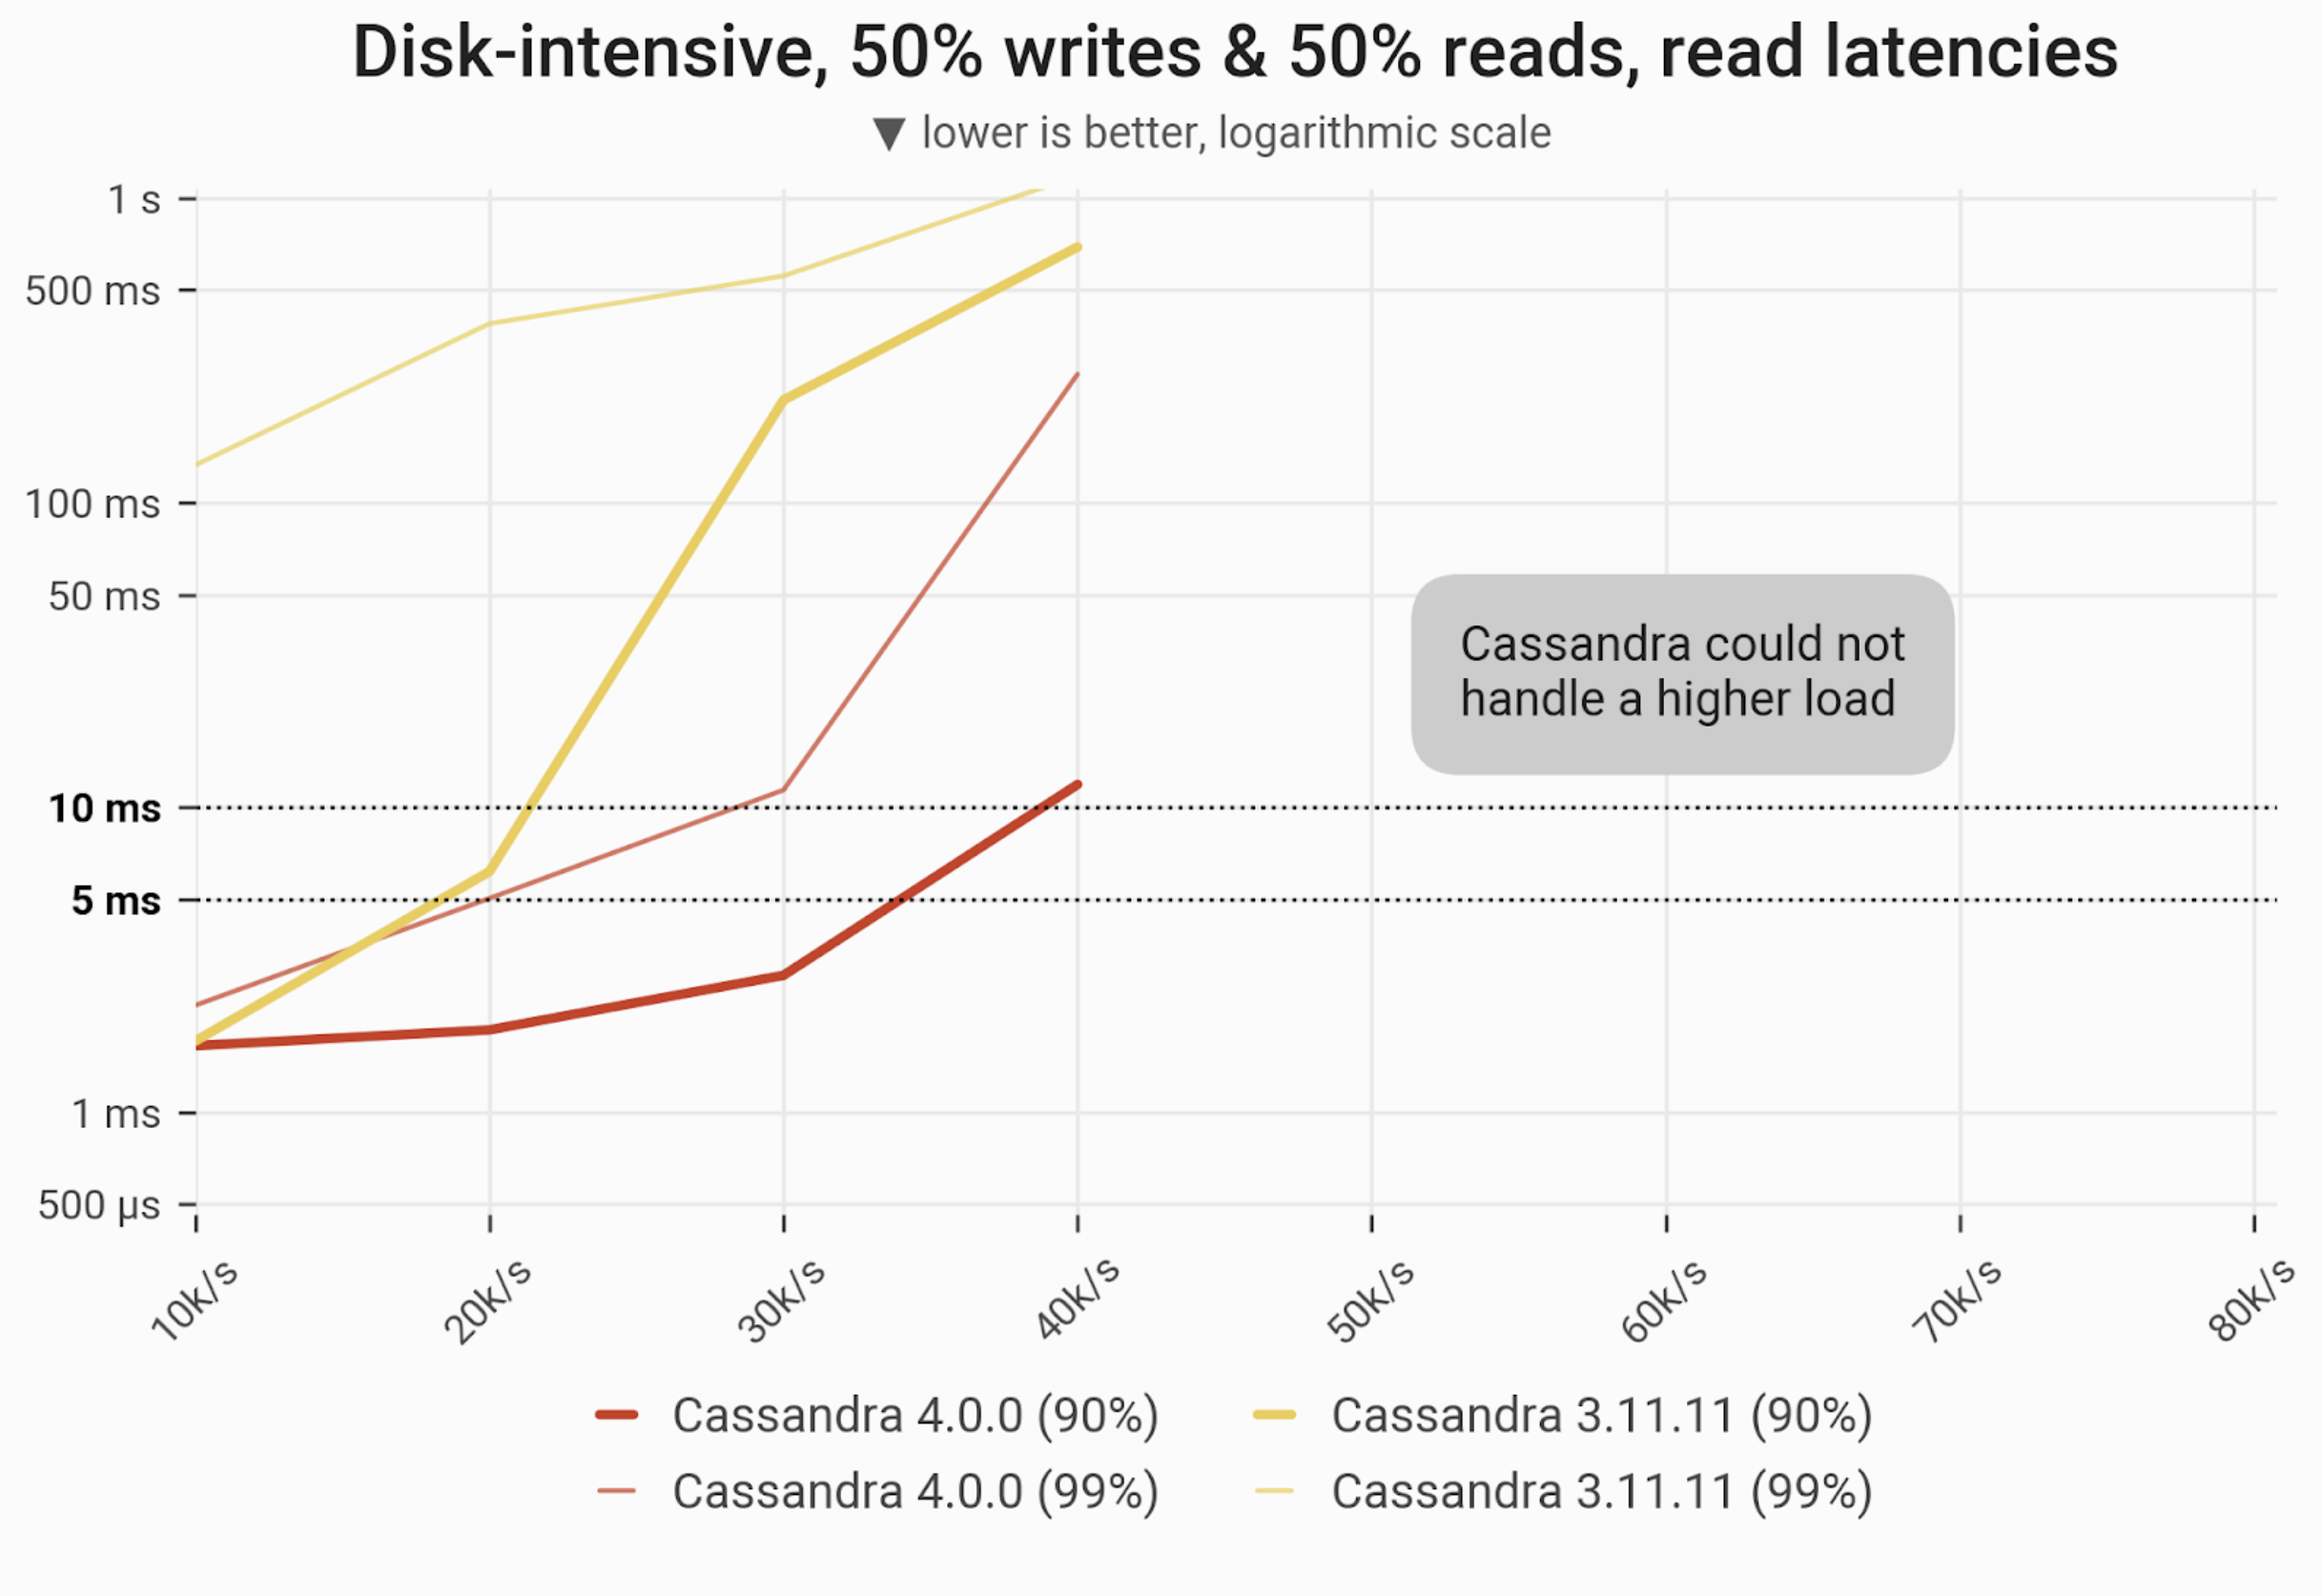
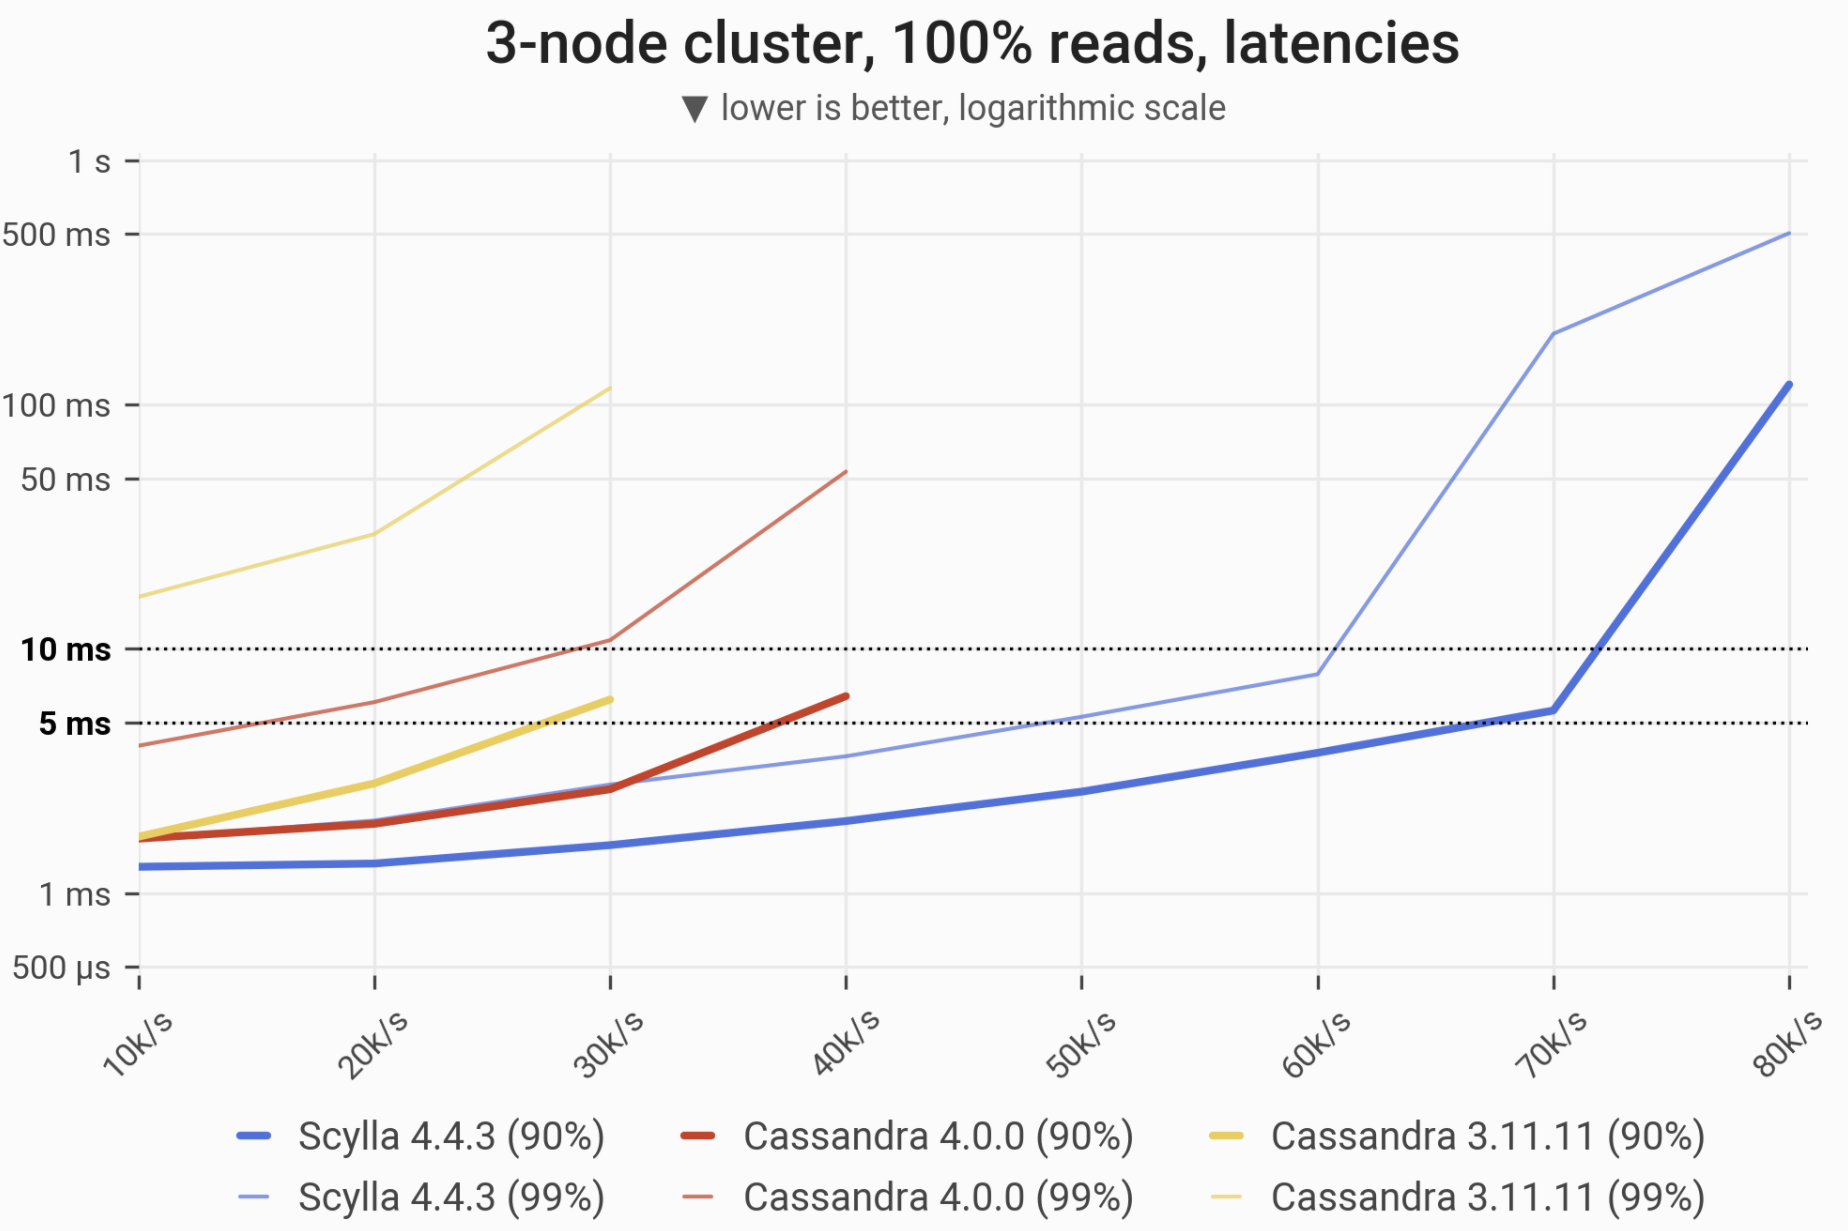
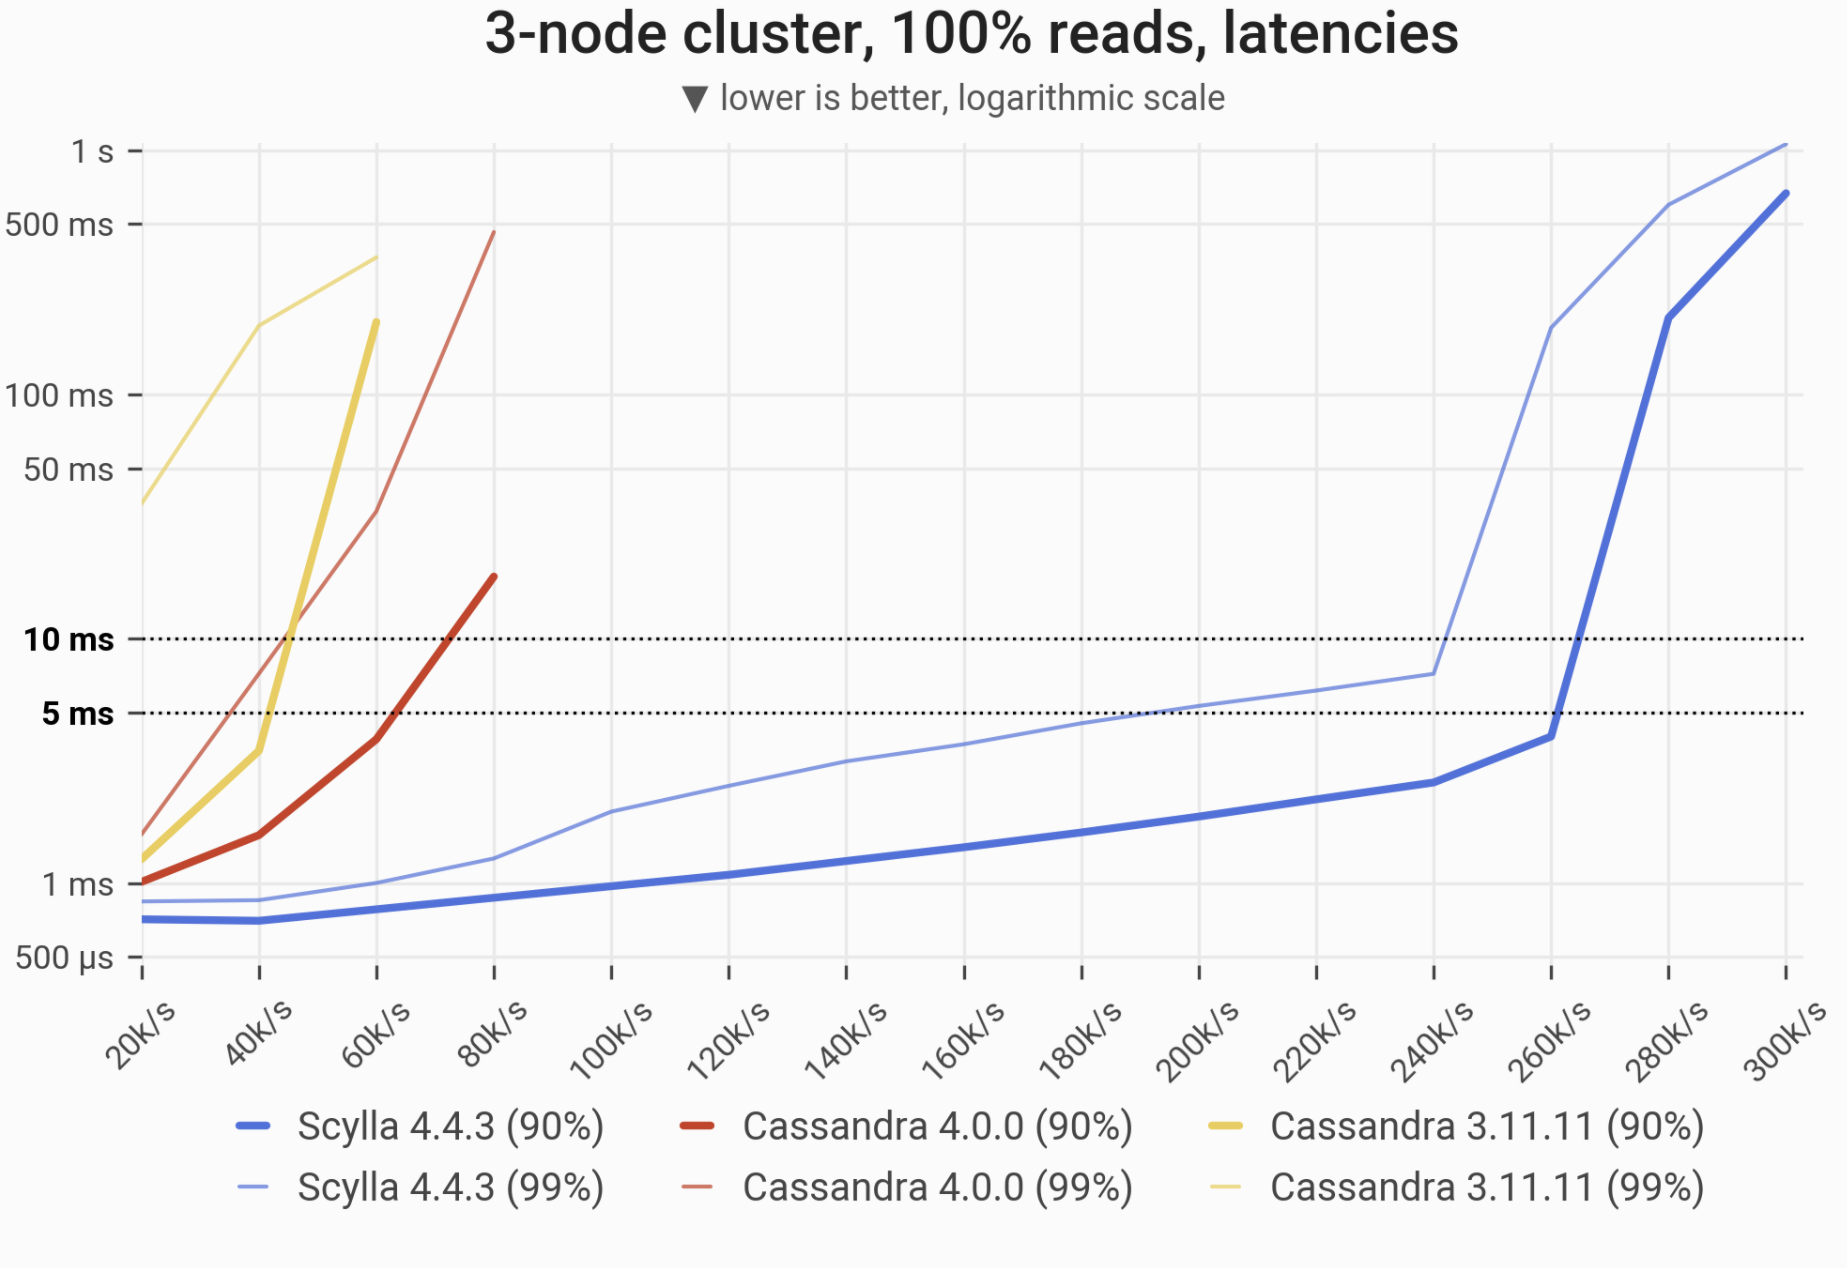
Reads Workload – Only Reads![]()
The 90- and 99-percentile latencies of SELECT queries, as measured on three i3.4xlarge machines (48 vCPUs in total) in a range of load rates. Workload is uniformly distributed, i.e. every partition in the 1 TB dataset has an equal chance of being selected. Scylla serves 90% of queries in a <5 ms time until the load reaches 70’000 ops/s. Please note that almost all reads are served from disk.
| Metric |
Scylla 4.4.3 |
Cassandra 4.0 |
Cassandra 3.11 |
Cassandra 4.0 vs. Cassandra 3.11 |
Scylla 4.4.3 vs. Cassandra 4.0 |
| Maximum throughput |
80k/s |
40k/s |
30k/s |
1.25x |
2x |
| Maximum throughput with 90% latency <10ms |
70k/s |
40k/s |
30k/s |
1.25x |
1.75x |
| Maximum throughput with 99% latency <10ms |
60k/s |
20k/s |
– |
– |
3x |
Mixed Workload – 50% reads and 50% writes
![]()
The 90- and 99-percentile latencies of UPDATE queries, as measured on three i3.4xlarge machines (48 vCPUs in total) in a range of load rates. Workload is uniformly distributed, i.e. every partition in the 1 TB dataset has an equal chance of being selected/updated. At 80,000 ops/s Scylla maintains the latencies of 99% of queries in a single-figure regime (in milliseconds).
| Metric |
Scylla 4.4.3 |
Cassandra 4.0 |
Cassandra 3.11 |
Cassandra 4.0 vs. Cassandra 3.11 |
Scylla 4.4.3 vs. Cassandra 4.0 |
| Maximum throughput |
90k/s |
40k/s |
40k/s |
1x |
2.25x |
| Maximum throughput with 90% latency <10ms |
80k/s |
40k/s |
20k/s |
2x |
2x |
| Maximum throughput with 99% latency <10ms |
80k/s |
30k/s |
– |
– |
2.66x |
![]()
The 90- and 99-percentile latencies of SELECT queries, as measured on three i3.4xlarge machines (48 vCPUs in total) in a range of load rates. Workload is uniformly distributed, i.e. every partition in the 1 TB dataset has an equal chance of being selected/updated. Under such conditions Scylla can handle over 2x more traffic and offers highly predictable response times.
| Metric |
Scylla 4.4.3 |
Cassandra 4.0 |
Cassandra 3.11 |
Cassandra 4.0 vs. Cassandra 3.11 |
Scylla 4.4.3 vs. Cassandra 4.0 |
| Maximum throughput |
90k/s |
40k/s |
40k/s |
1x |
2.25x |
| Maximum throughput with 90% latency <10ms |
80k/s |
30k/s |
20k/s |
1.5x |
2.66x |
| Maximum throughput with 99% latency <10ms |
60k/s |
20k/s |
– |
– |
3x |
Uniform Distribution (memory-intensive, high cache hit ratio)
In this scenario we issue queries touching random partitions from a small subset of the dataset, specifically: one that fits into RAM. To be sure that our subset resides in cache and thus no disk IO is triggered, we choose it to be safely small, at an arbitrarily picked value of 60 GB. The goal here is to evaluate both databases at the other extreme end: where they both serve as pure in-memory datastores.
Writes Workload – Only Writes
![]()
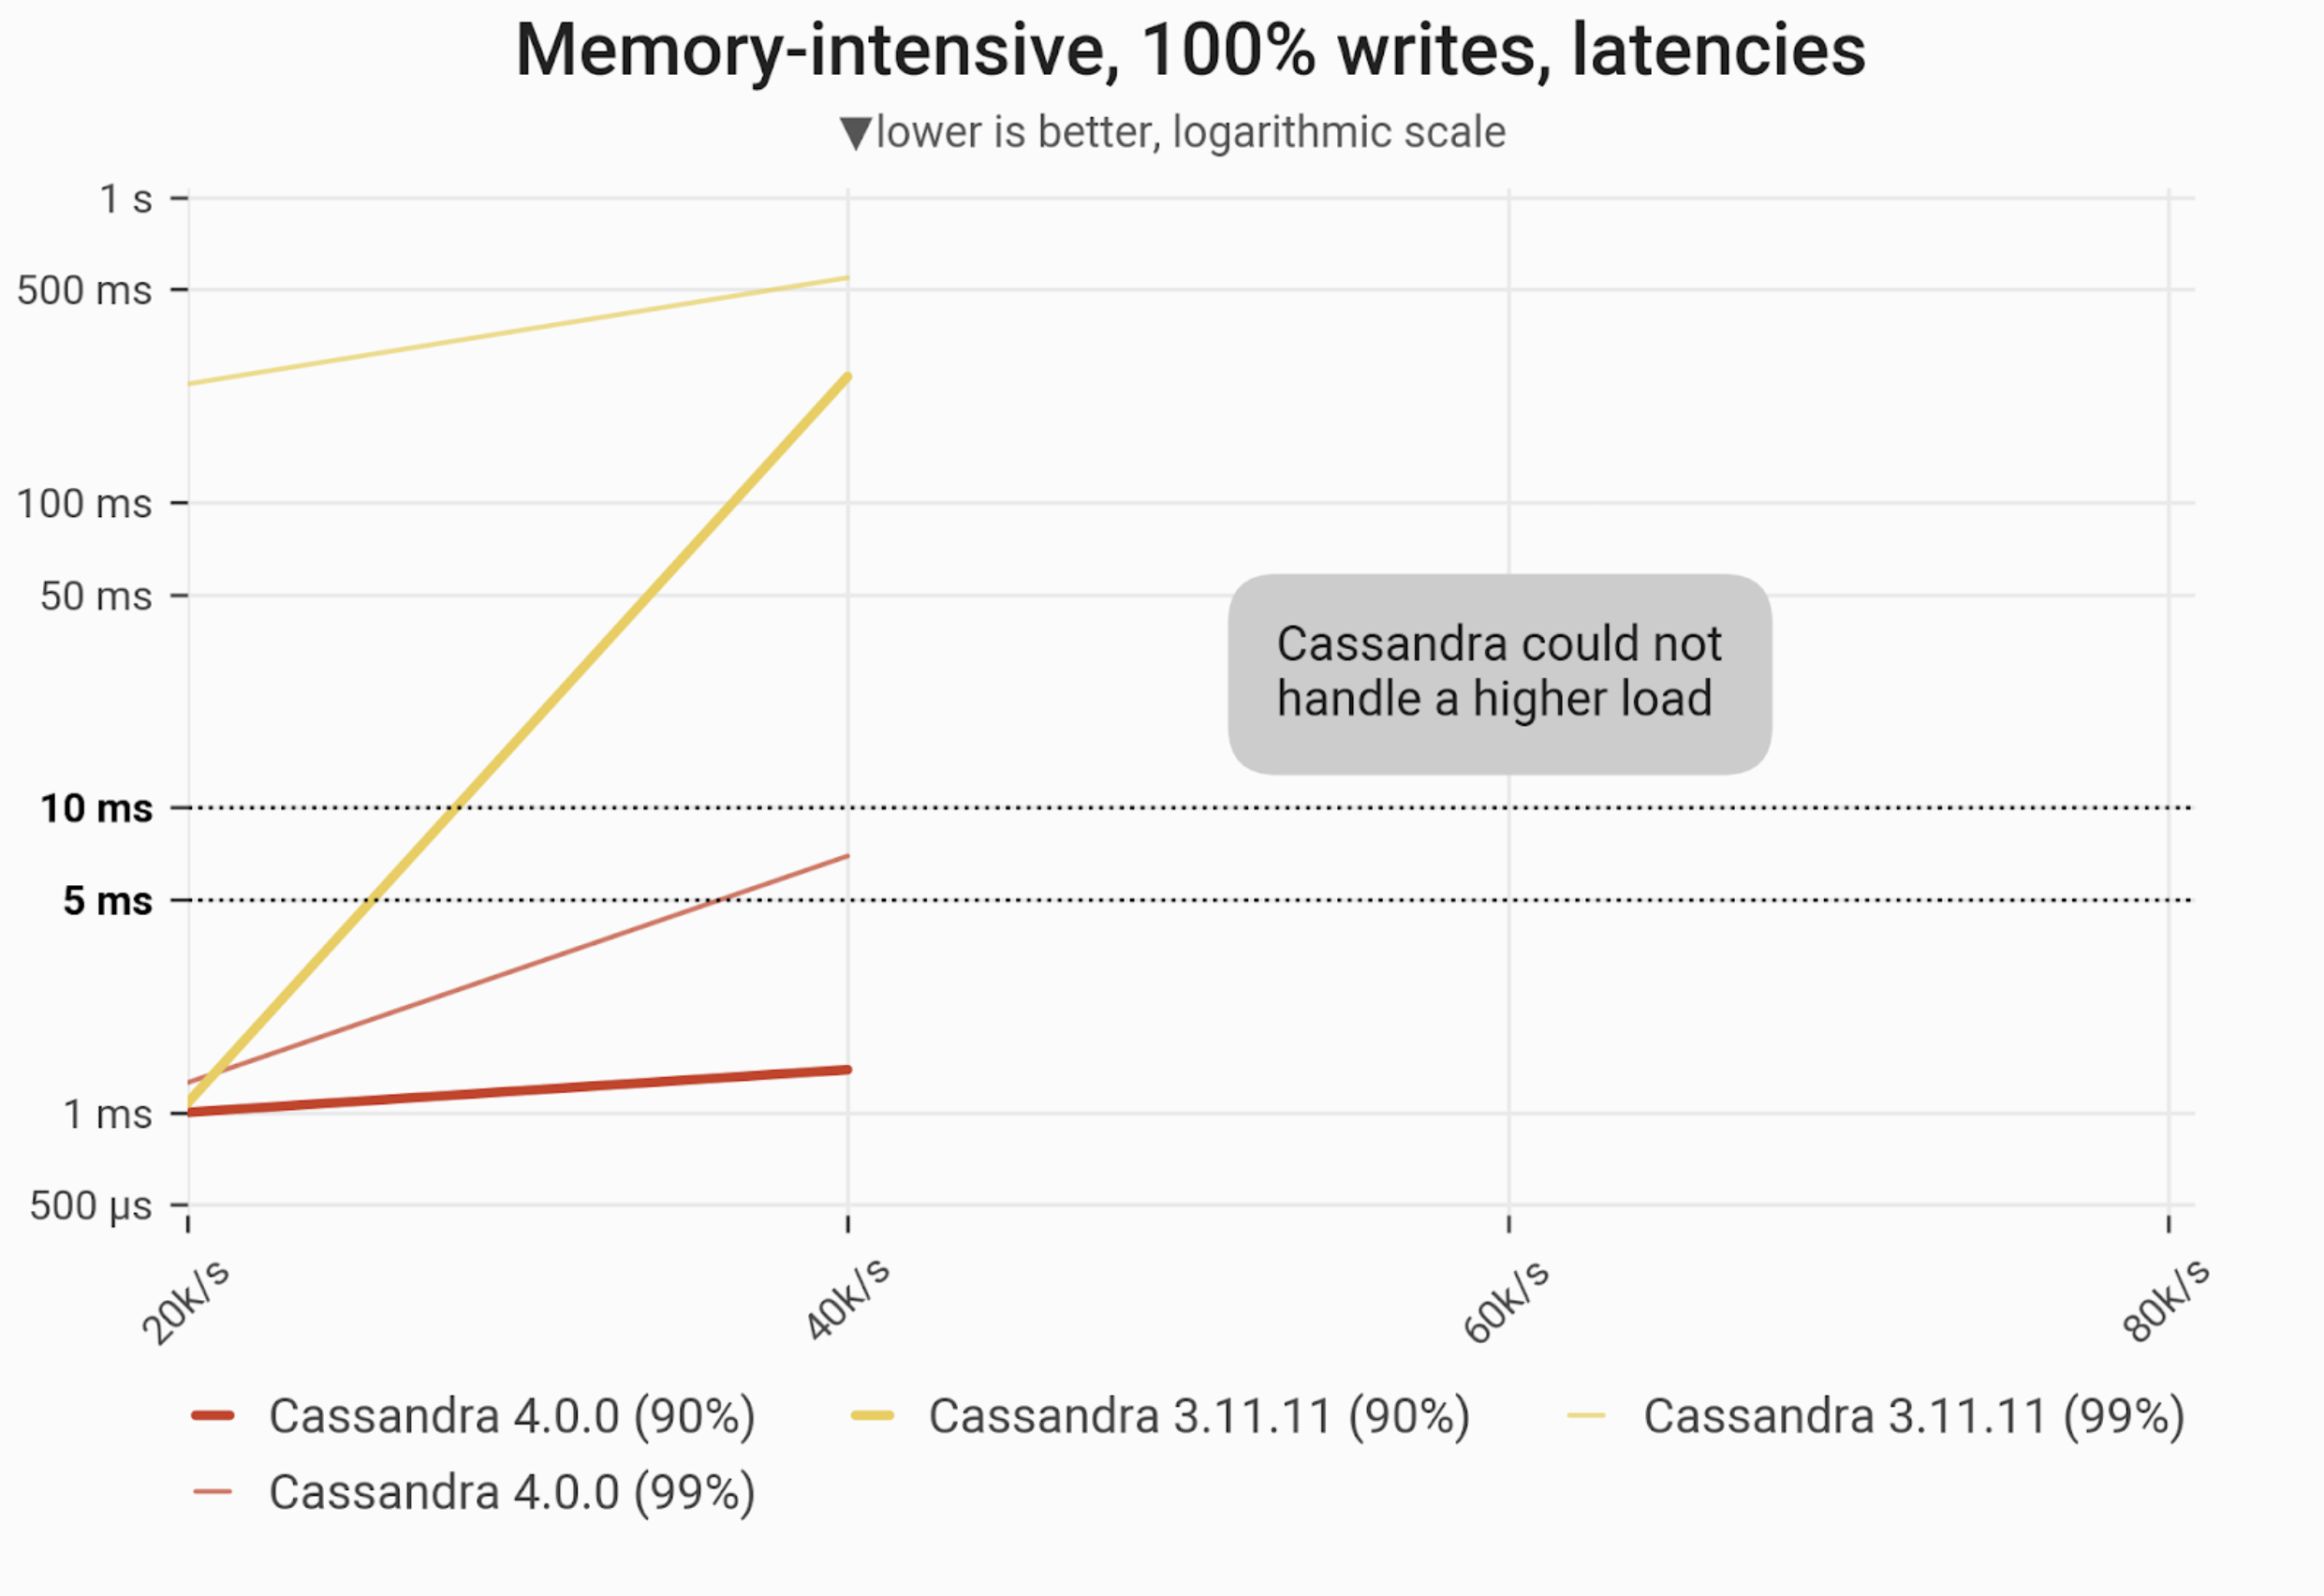
The 90- and 99-percentile latencies of UPDATE queries, as measured on three i3.4xlarge machines (48 vCPUs in total) in a range of load rates. Workload is uniformly distributed over 60 GB of data, so that every partition resides in cache and has an equal chance of being updated. Cassandras instantly become nonoperational; Scylla withstands over 5x higher load and maintains low and consistent write latencies over the entire range.
| Metric |
Scylla 4.4.3 |
Cassandra 4.0 |
Cassandra 3.11 |
Cassandra 4.0 vs. Cassandra 3.11 |
Scylla 4.4.3 vs. Cassandra 4.0 |
| Maximum throughput |
200k/s |
40k/s |
40k/s |
1x |
5x |
| Maximum throughput with 90% latency <10ms |
200k/s |
40k/s |
20k/s |
2x |
5x |
| Maximum throughput with 99% latency <10ms |
200k/s |
40k/s |
– |
– |
5x |
Reads Workload – Only Reads
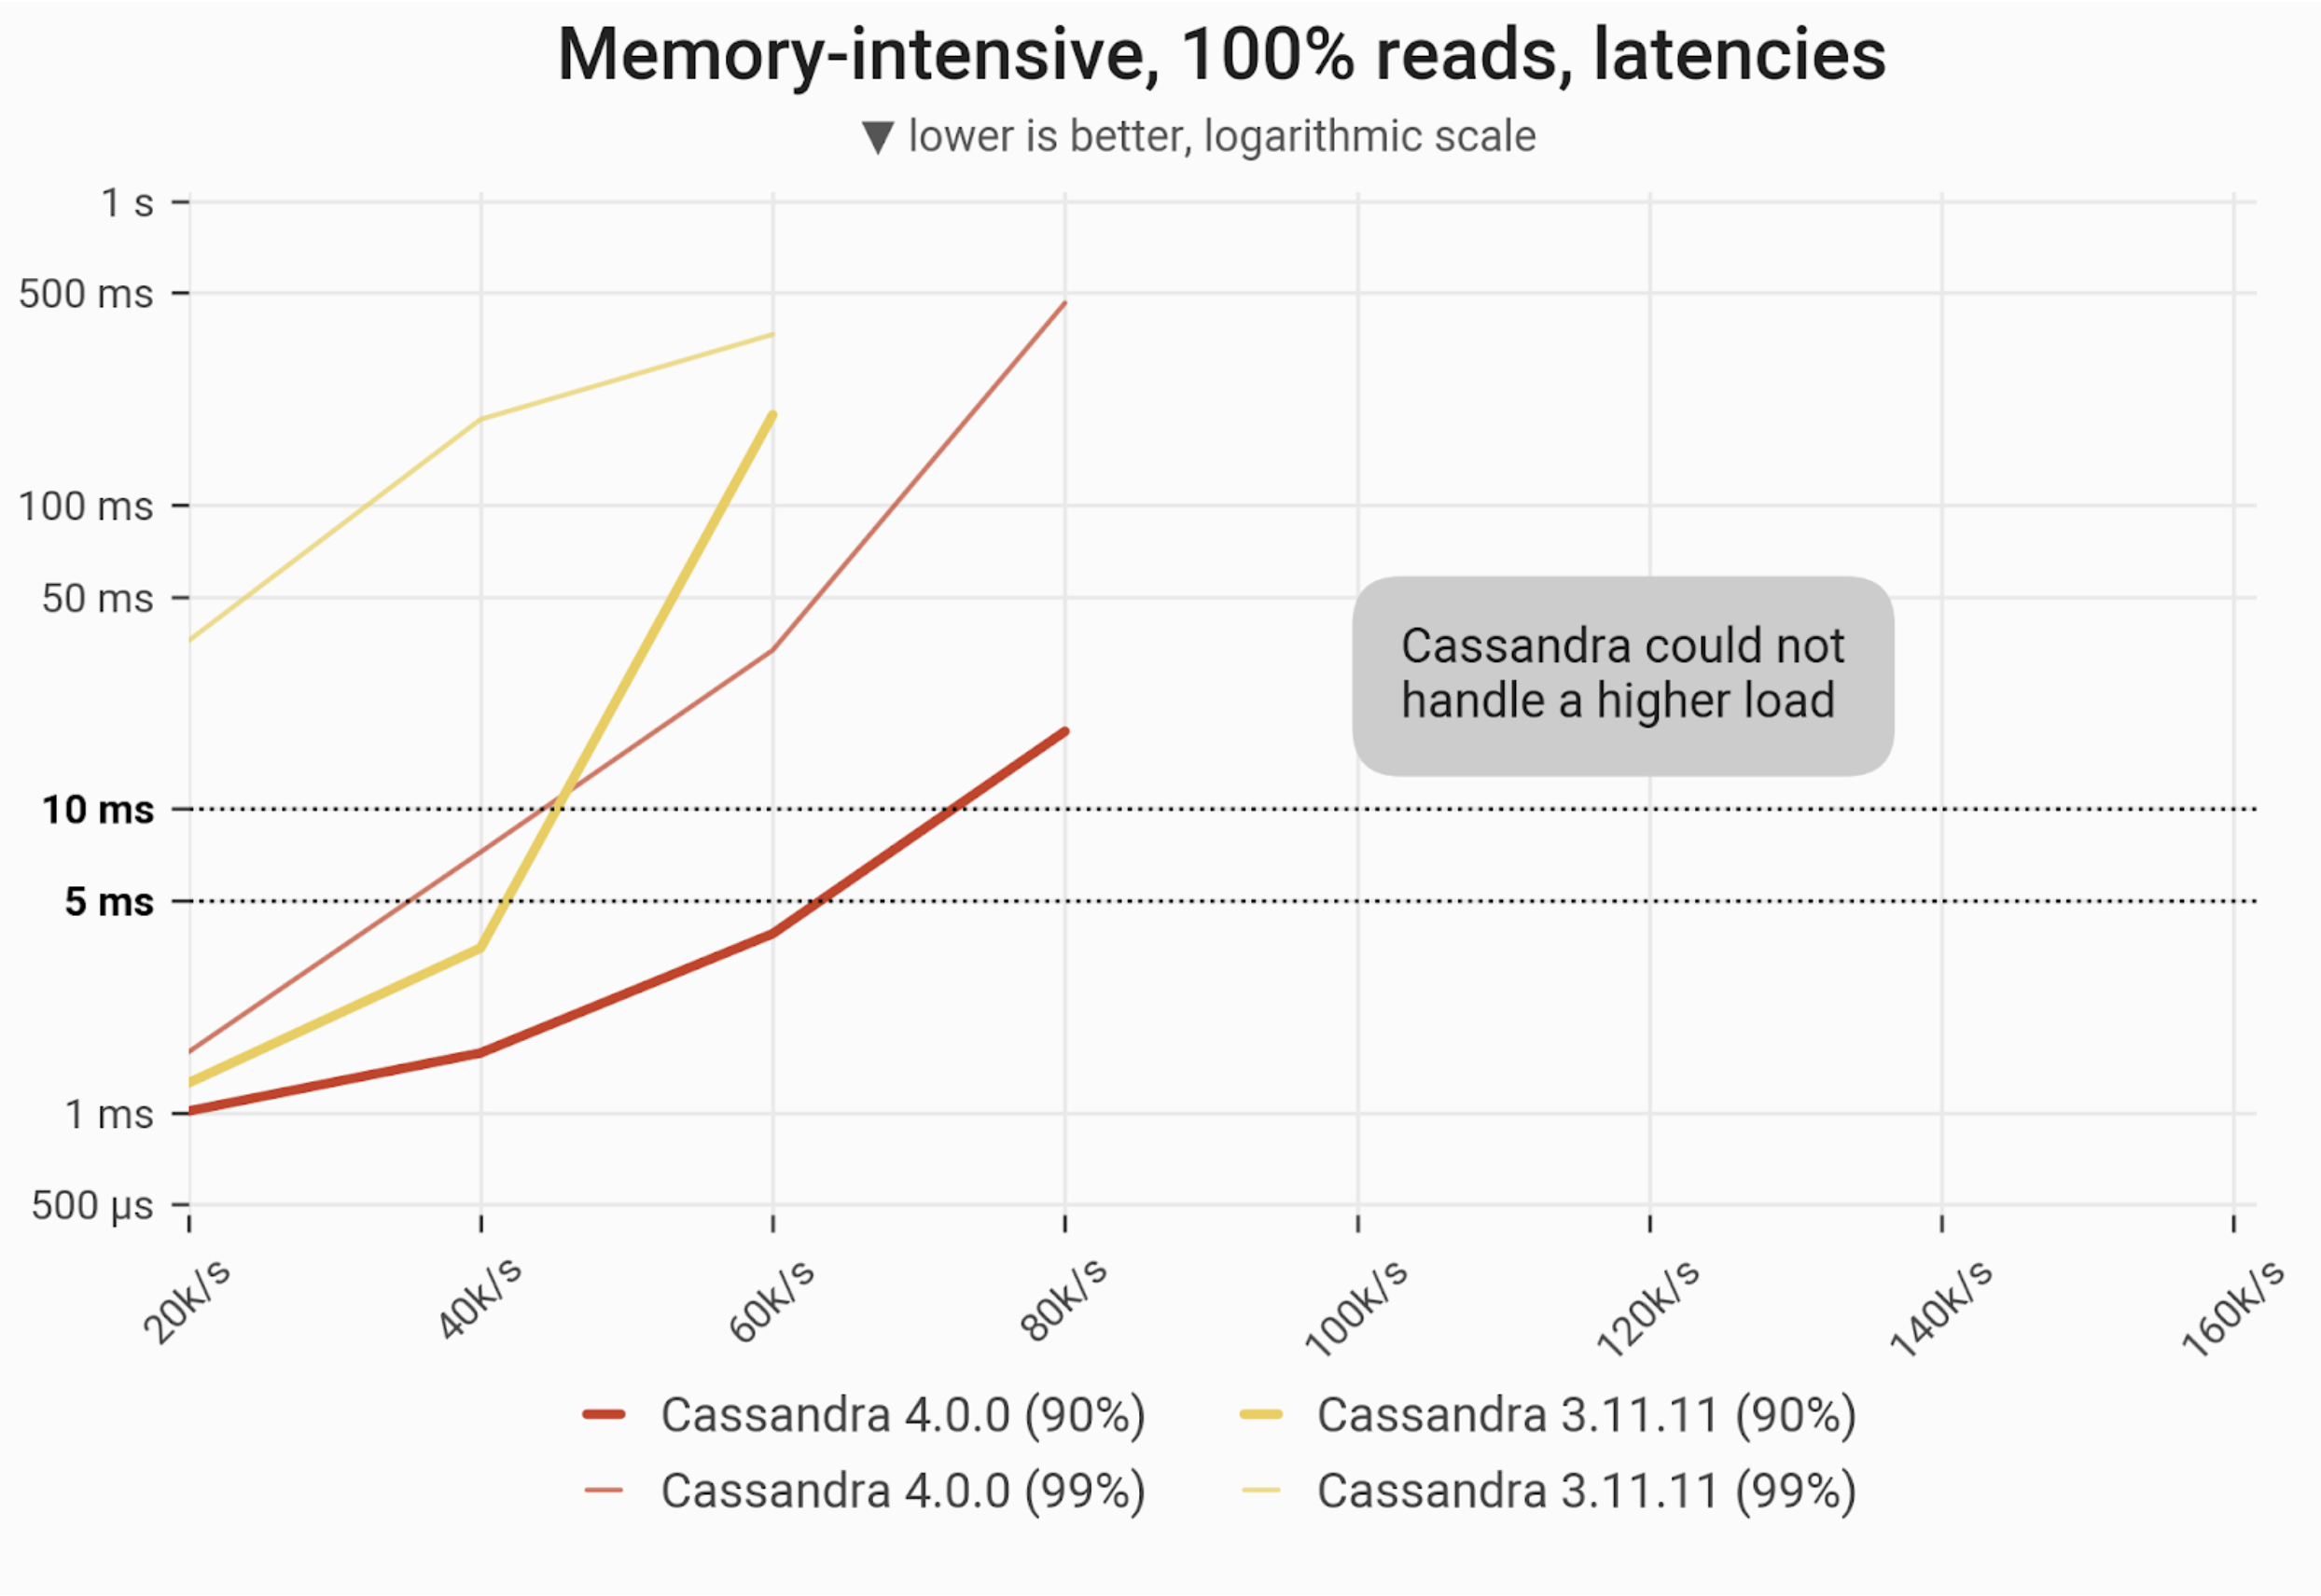
![]()
The 90- and 99-percentile latencies of SELECT queries, as measured on three i3.4xlarge machines (48 vCPUs in total) in a range of load rates. Workload is uniformly distributed over 60 GB of data, so that every partition resides in cache and has an equal chance of being selected. Scylla withstands over 3x higher load than C*4 and 4x greater than C*3.
| Metric |
Scylla 4.4.3 |
Cassandra 4.0 |
Cassandra 3.11 |
Cassandra 4.0 vs. Cassandra 3.11 |
Scylla 4.4.3 vs. Cassandra 4.0 |
| Maximum throughput |
300k/s |
80k/s |
60k/s |
1.33x |
3.75x |
| Maximum throughput with 90% latency <10ms |
260k/s |
60k/s |
40k/s |
1.5x |
4.33x |
| Maximum throughput with 99% latency <10ms |
240k/s |
40k/s |
– |
– |
6x |
Mixed Workload – 50% reads and 50% writes
![]()
The 90- and 99-percentile latencies of UPDATE queries, as measured on three i3.4xlarge machines (48 vCPUs in total) in a range of load rates. Workload is uniformly distributed over 60 GB of data, so that every partition resides in cache and has an equal chance of being selected/updated. Scylla withstands over 3x higher load than any of the Cassandras.
| Metric |
Scylla 4.4.3 |
Cassandra 4.0 |
Cassandra 3.11 |
Cassandra 4.0 vs. Cassandra 3.11 |
Scylla 4.4.3 vs. Cassandra 4.0 |
| Maximum throughput |
180k/s |
40k/s |
40k/s |
1x |
4.5x |
| Maximum throughput with 90% latency <10ms |
160k/s |
40k/s |
20k/s |
2x |
4x |
| Maximum throughput with 99% latency <10ms |
160k/s |
40k/s |
– |
– |
4x |
![]()
The 90- and 99-percentile latencies of SELECT queries, as measured on three i3.4xlarge machines (48 vCPUs in total) in a range of load rates. Workload is uniformly distributed over 60 GB of data, so that every partition resides in cache and has an equal chance of being selected/updated. Scylla withstands over 3x higher load than any of the Cassandras.
| Metric |
Scylla 4.4.3 |
Cassandra 4.0 |
Cassandra 3.11 |
Cassandra 4.0 vs. Cassandra 3.11 |
Scylla 4.4.3 vs. Cassandra 4.0 |
| Maximum throughput |
180k/s |
40k/s |
40k/s |
1x |
4.5x |
| Maximum throughput with 90% latency <10ms |
160k/s |
40k/s |
20k/s |
2x |
4x |
| Maximum throughput with 99% latency <10ms |
160k/s |
20k/s |
– |
– |
8x |
Adding Nodes
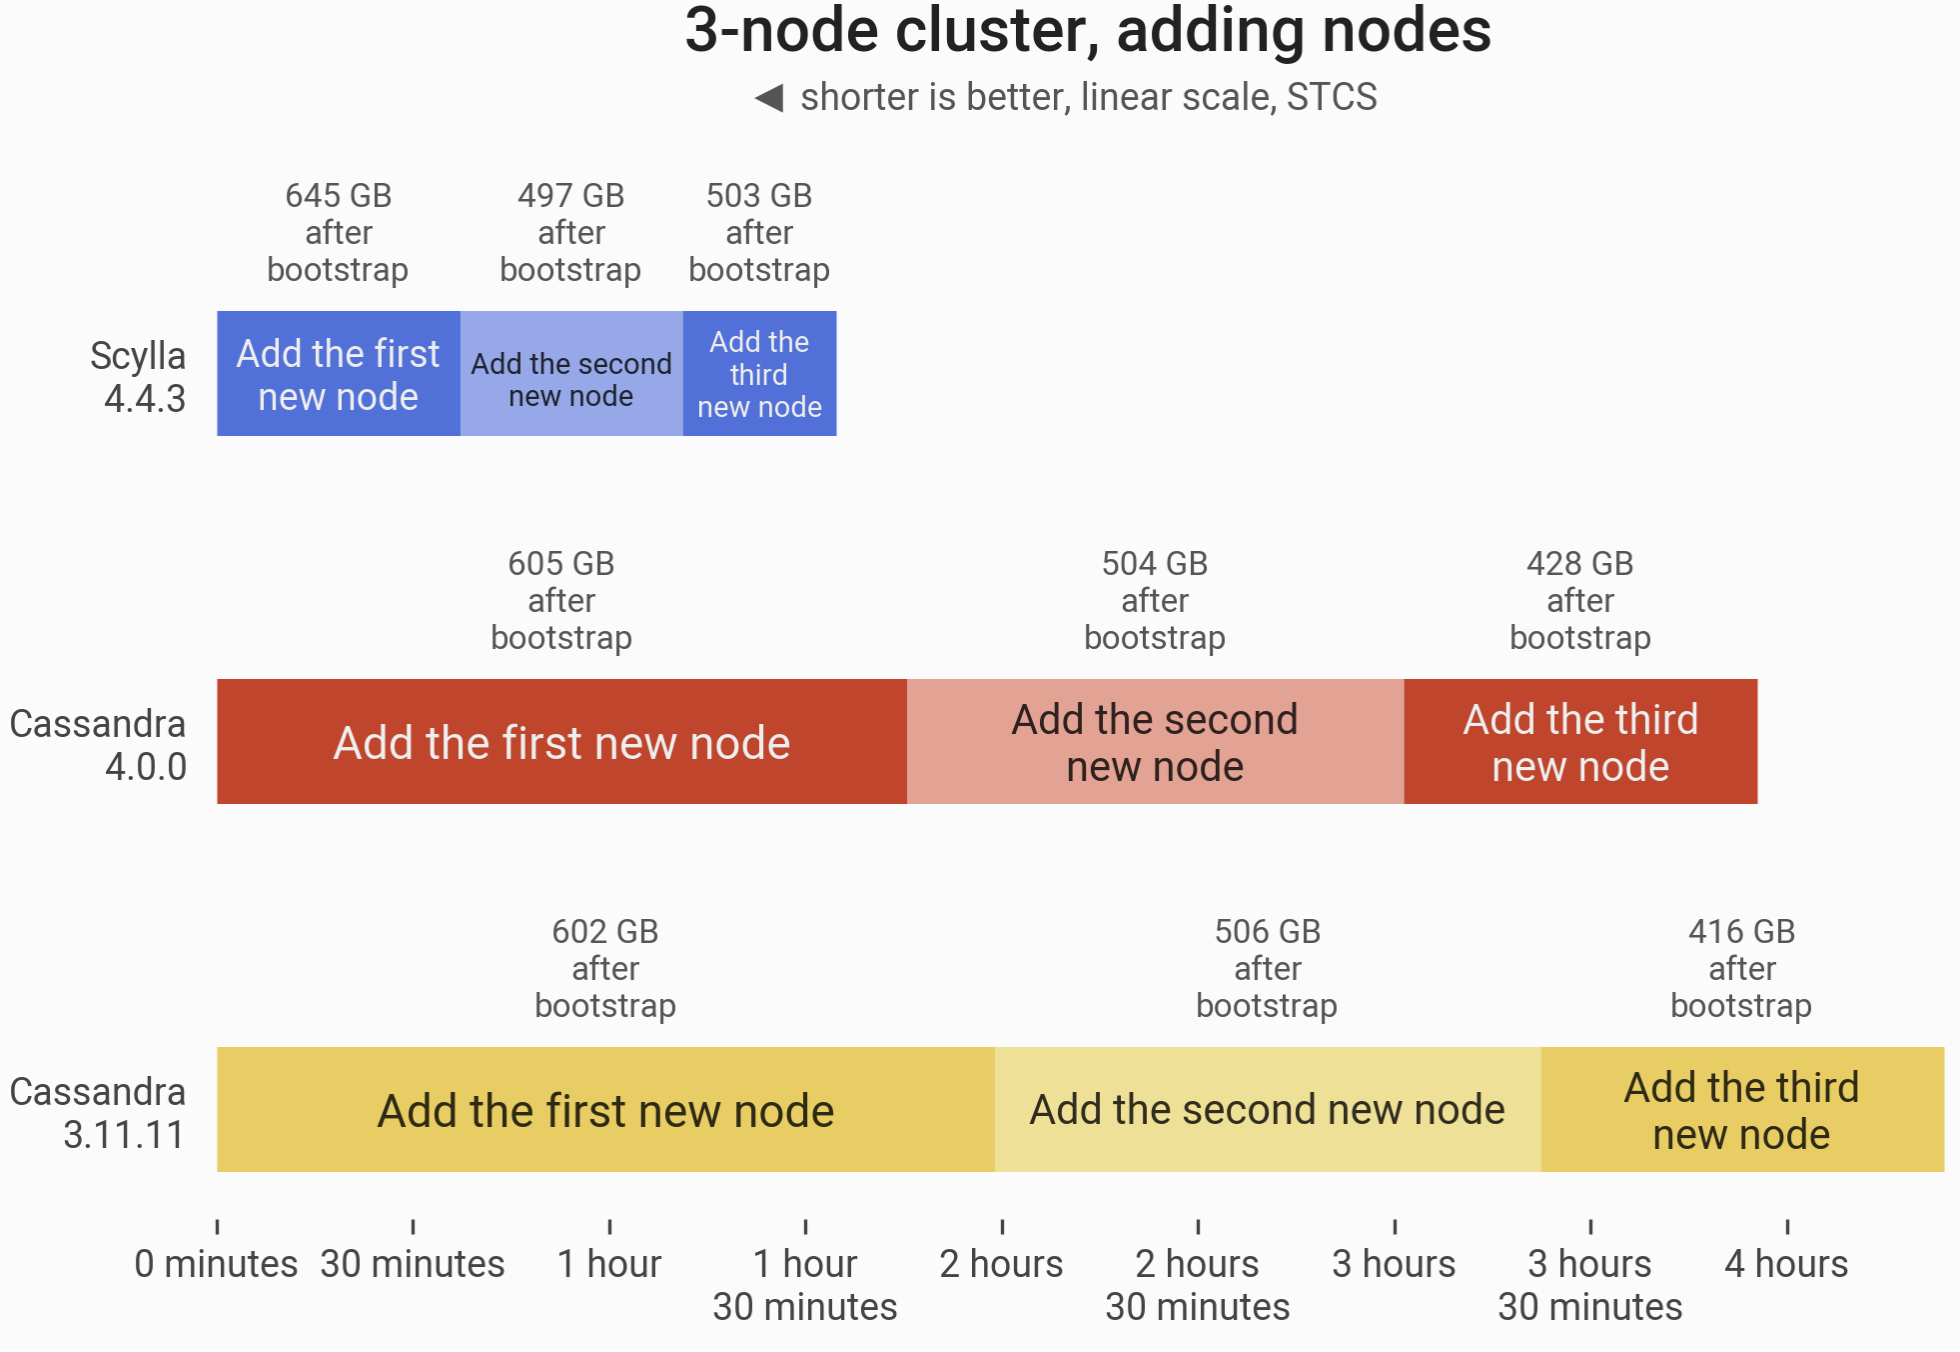
![]()
The timeline of adding 3 nodes to an already existing 3-node cluster (ending up with six i3.4xlarge machines). Total time for Scylla 4.4 to double the cluster size was 94 minutes 57 seconds. For Cassandra 4.0, it took 238 minutes 21 seconds (just shy of 4 hours); Cassandra 3.11 took 270 minutes (4.5 hours). While Cassandra 4.0 noted a 12% improvement over Cassandra 3.11, Scylla completes the entire operation even before either version of Cassandra bootstraps its first new node.
One New Node
In this benchmark, we measured how long it takes to add a new node to the cluster. The reported times are the intervals between starting a Scylla/Cassandra node and having it fully finished bootstrapping (CQL port open).
Cassandra 4.0 is equipped with a new feature — Zero Copy Streaming — which allows for efficient streaming of entire SSTables. An SSTable is eligible for ZCS if all of it’s partitions need to be transferred, which can be the case when LeveledCompactionStrategy (LCS) is enabled. Willing to demonstrate this feature, we run the next benchmarks with the usual SizeTieredCompactionStrategy (STCS) compared to LCS.
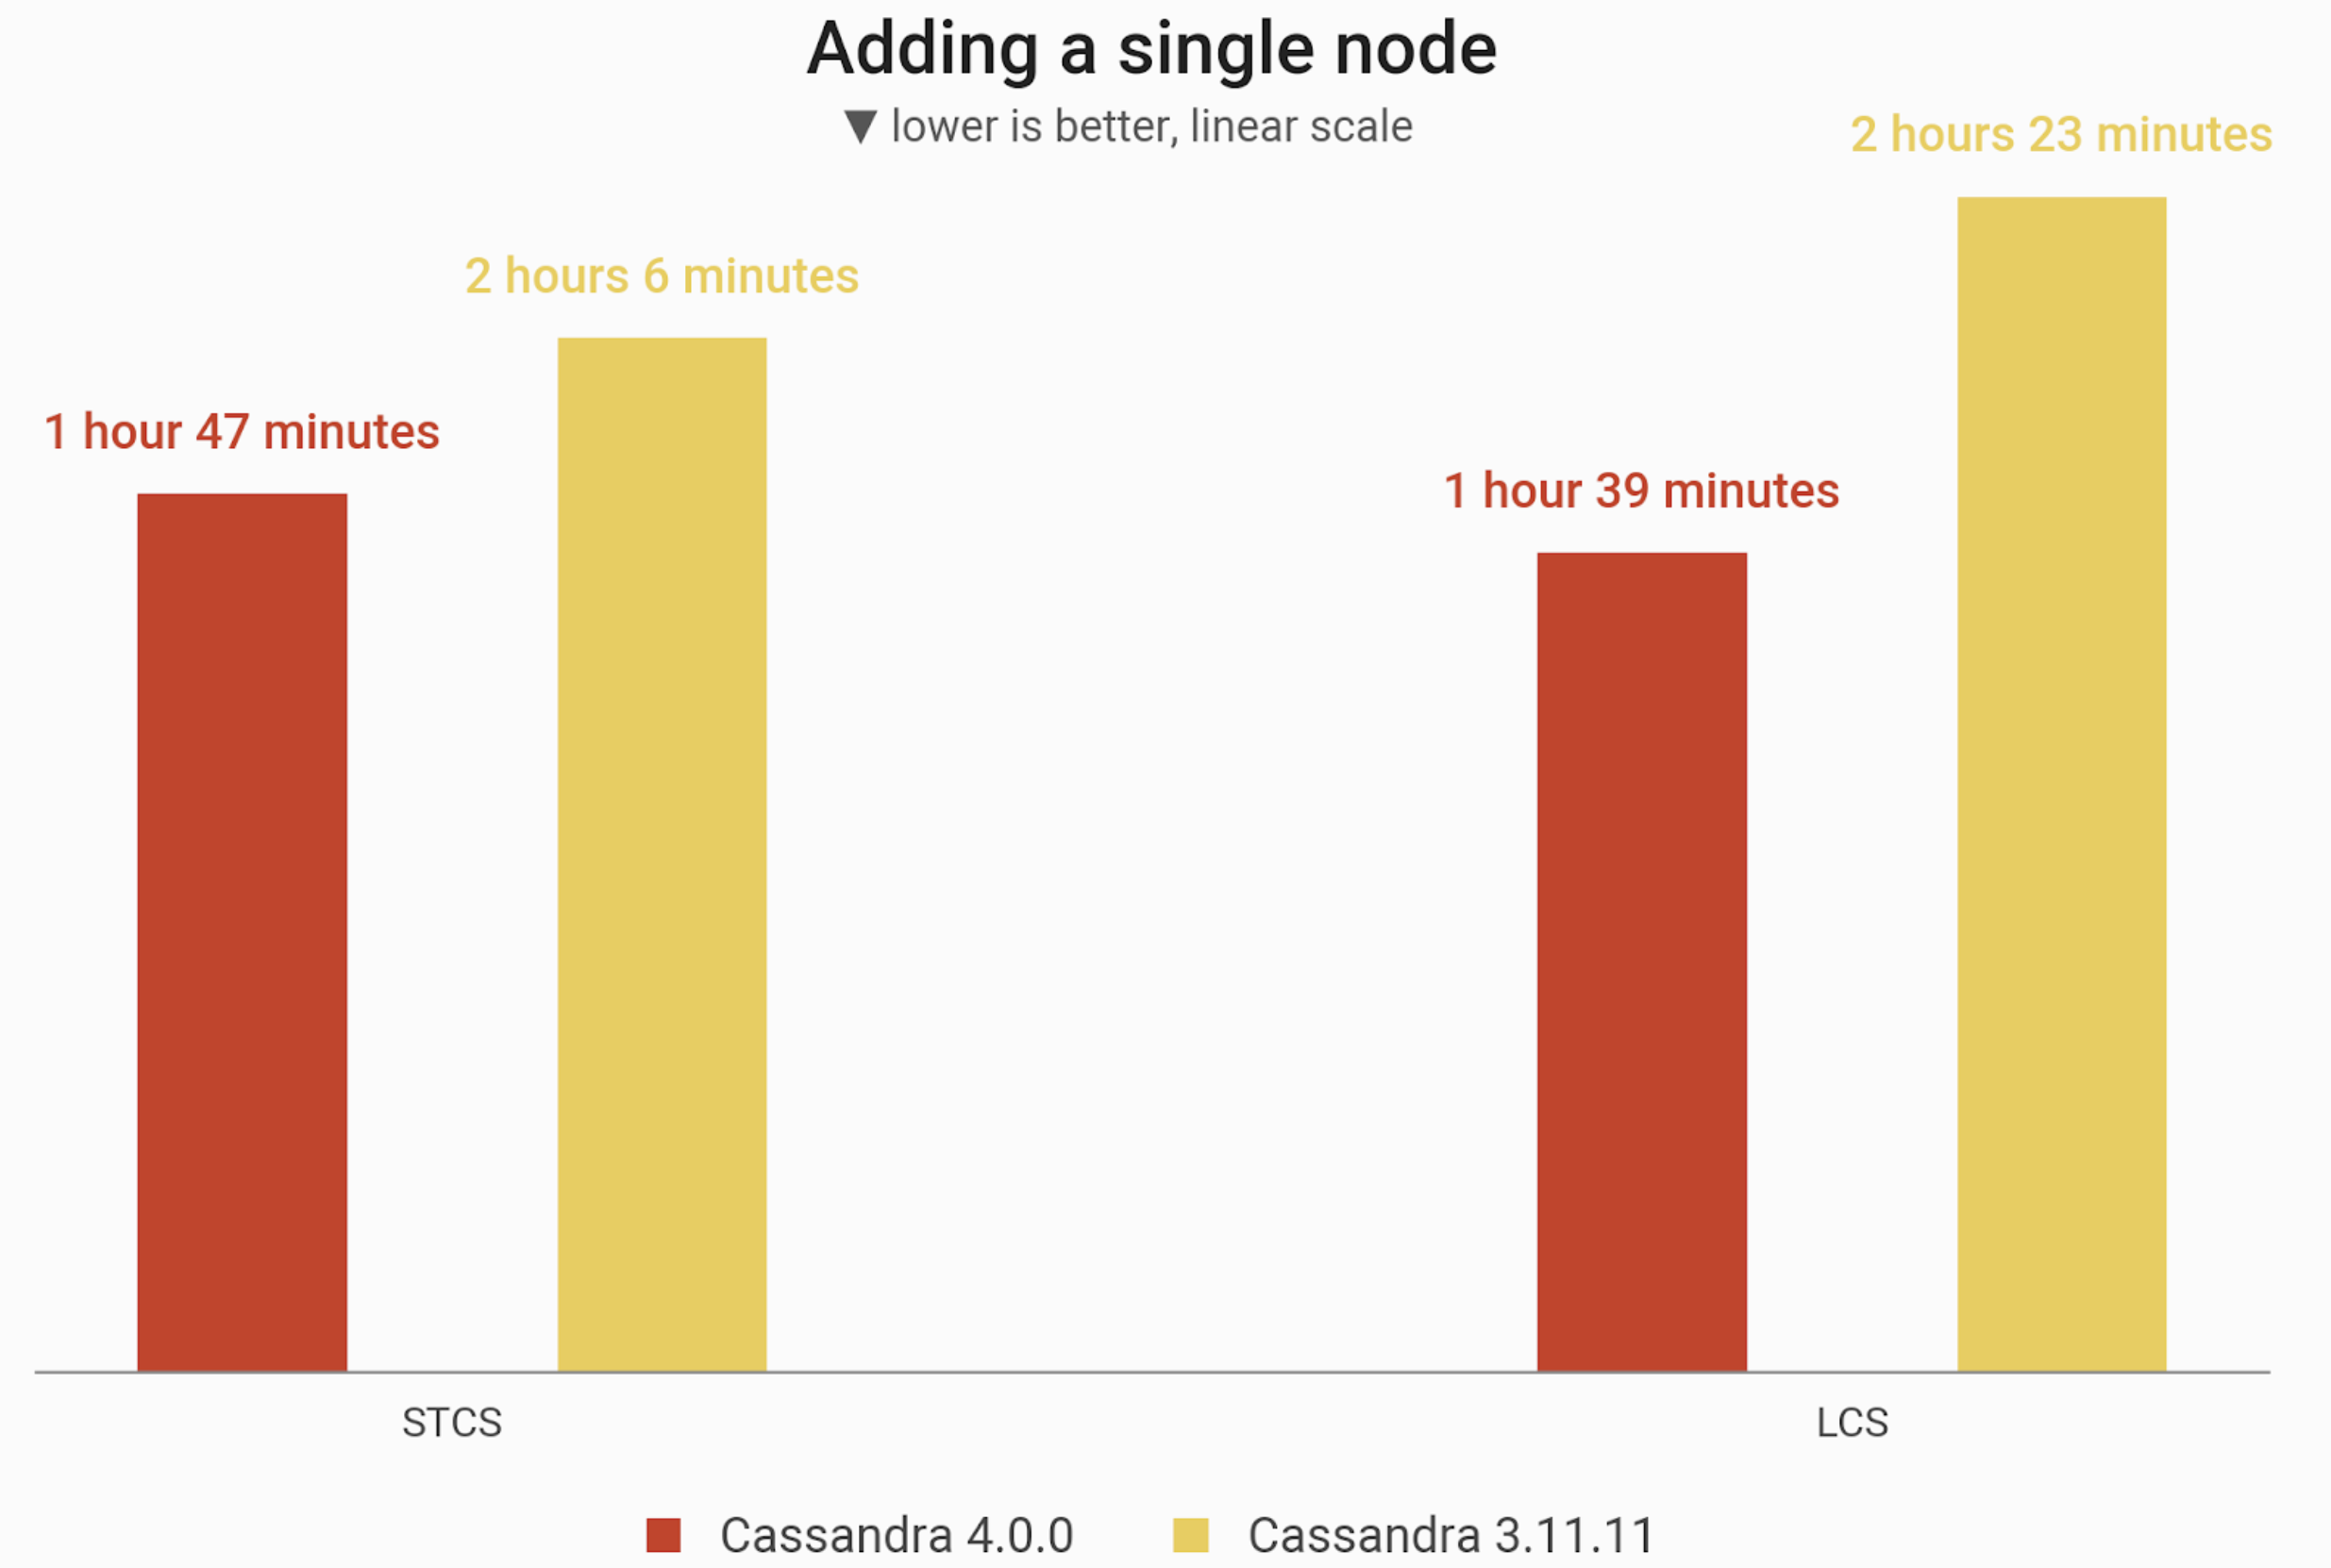
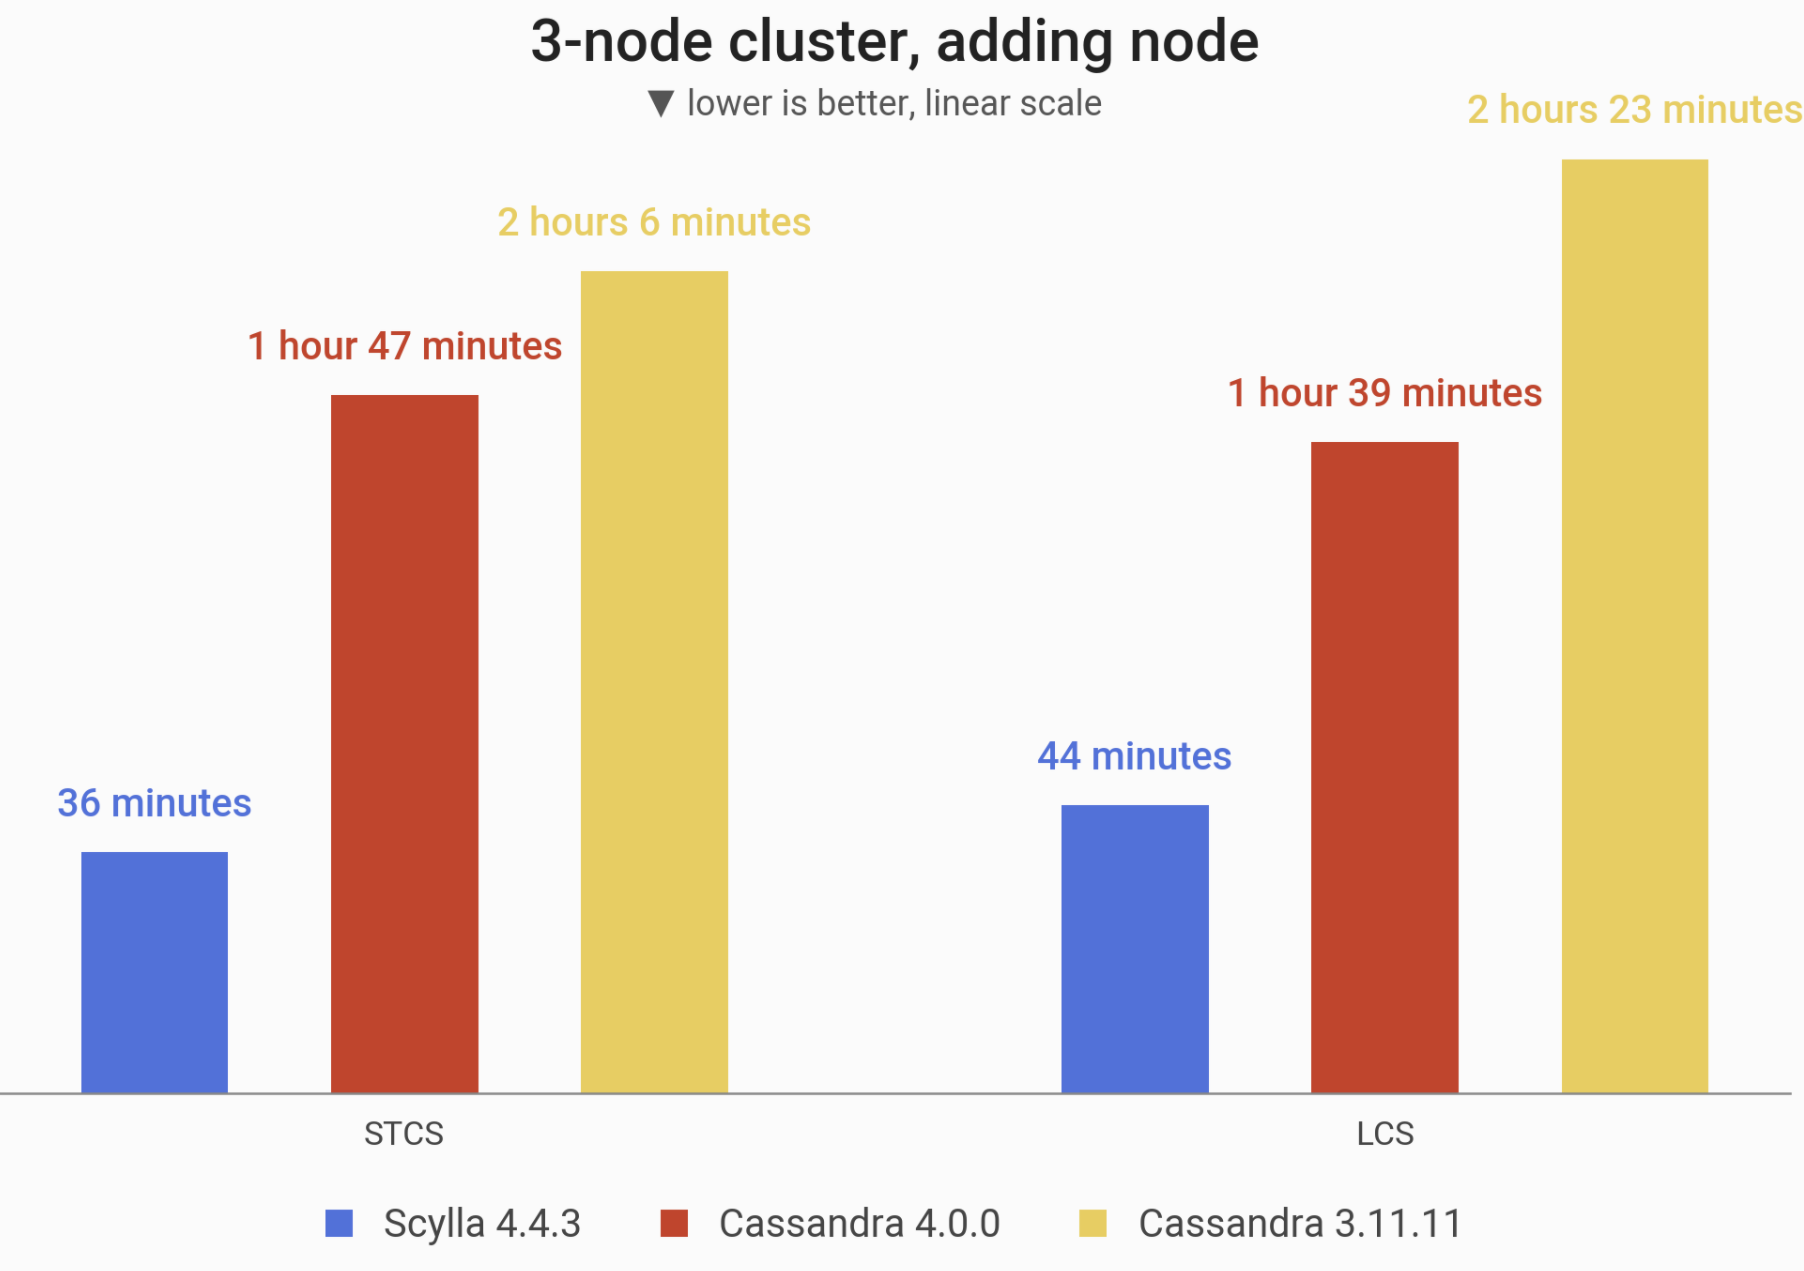
![]()
The time needed to add a node to an already existing 3-node cluster (ending up with 4 i3.4xlarge machines). Cluster is initially loaded with 1 TB of data at RF=3. Cassandra 4.0 showed an improvement over Cassandra 3.11, but Scylla still wins by a huge margin.
| Strategy |
Scylla 4.4.3 |
Cassandra 4.0 |
Cassandra 3.11 |
| STCS |
36 minutes 56 seconds |
1 hour 47 minutes 1 second |
2 hours 6 minutes |
| LCS |
44 minutes 11 seconds |
1 hour 39 minutes 45 seconds |
2 hours 23 minutes 10 seconds |
| Strategy |
Cassandra 4.0 vs Cassandra 3.11 |
Scylla 4.4.3 vs Cassandra 4.0 |
| STCS |
-15% |
-65% |
| LCS |
-30% |
-55% |
Doubling Cluster Size
In this benchmark, we measured how long it takes to double the cluster node count, going from 3 nodes to 6 nodes. Three new nodes are added sequentially, i.e. waiting for the previous one to fully bootstrap before starting the next one. The reported time spans from the instant the startup of the first new node is initiated, all the way until the bootstrap of the third new node finishes.
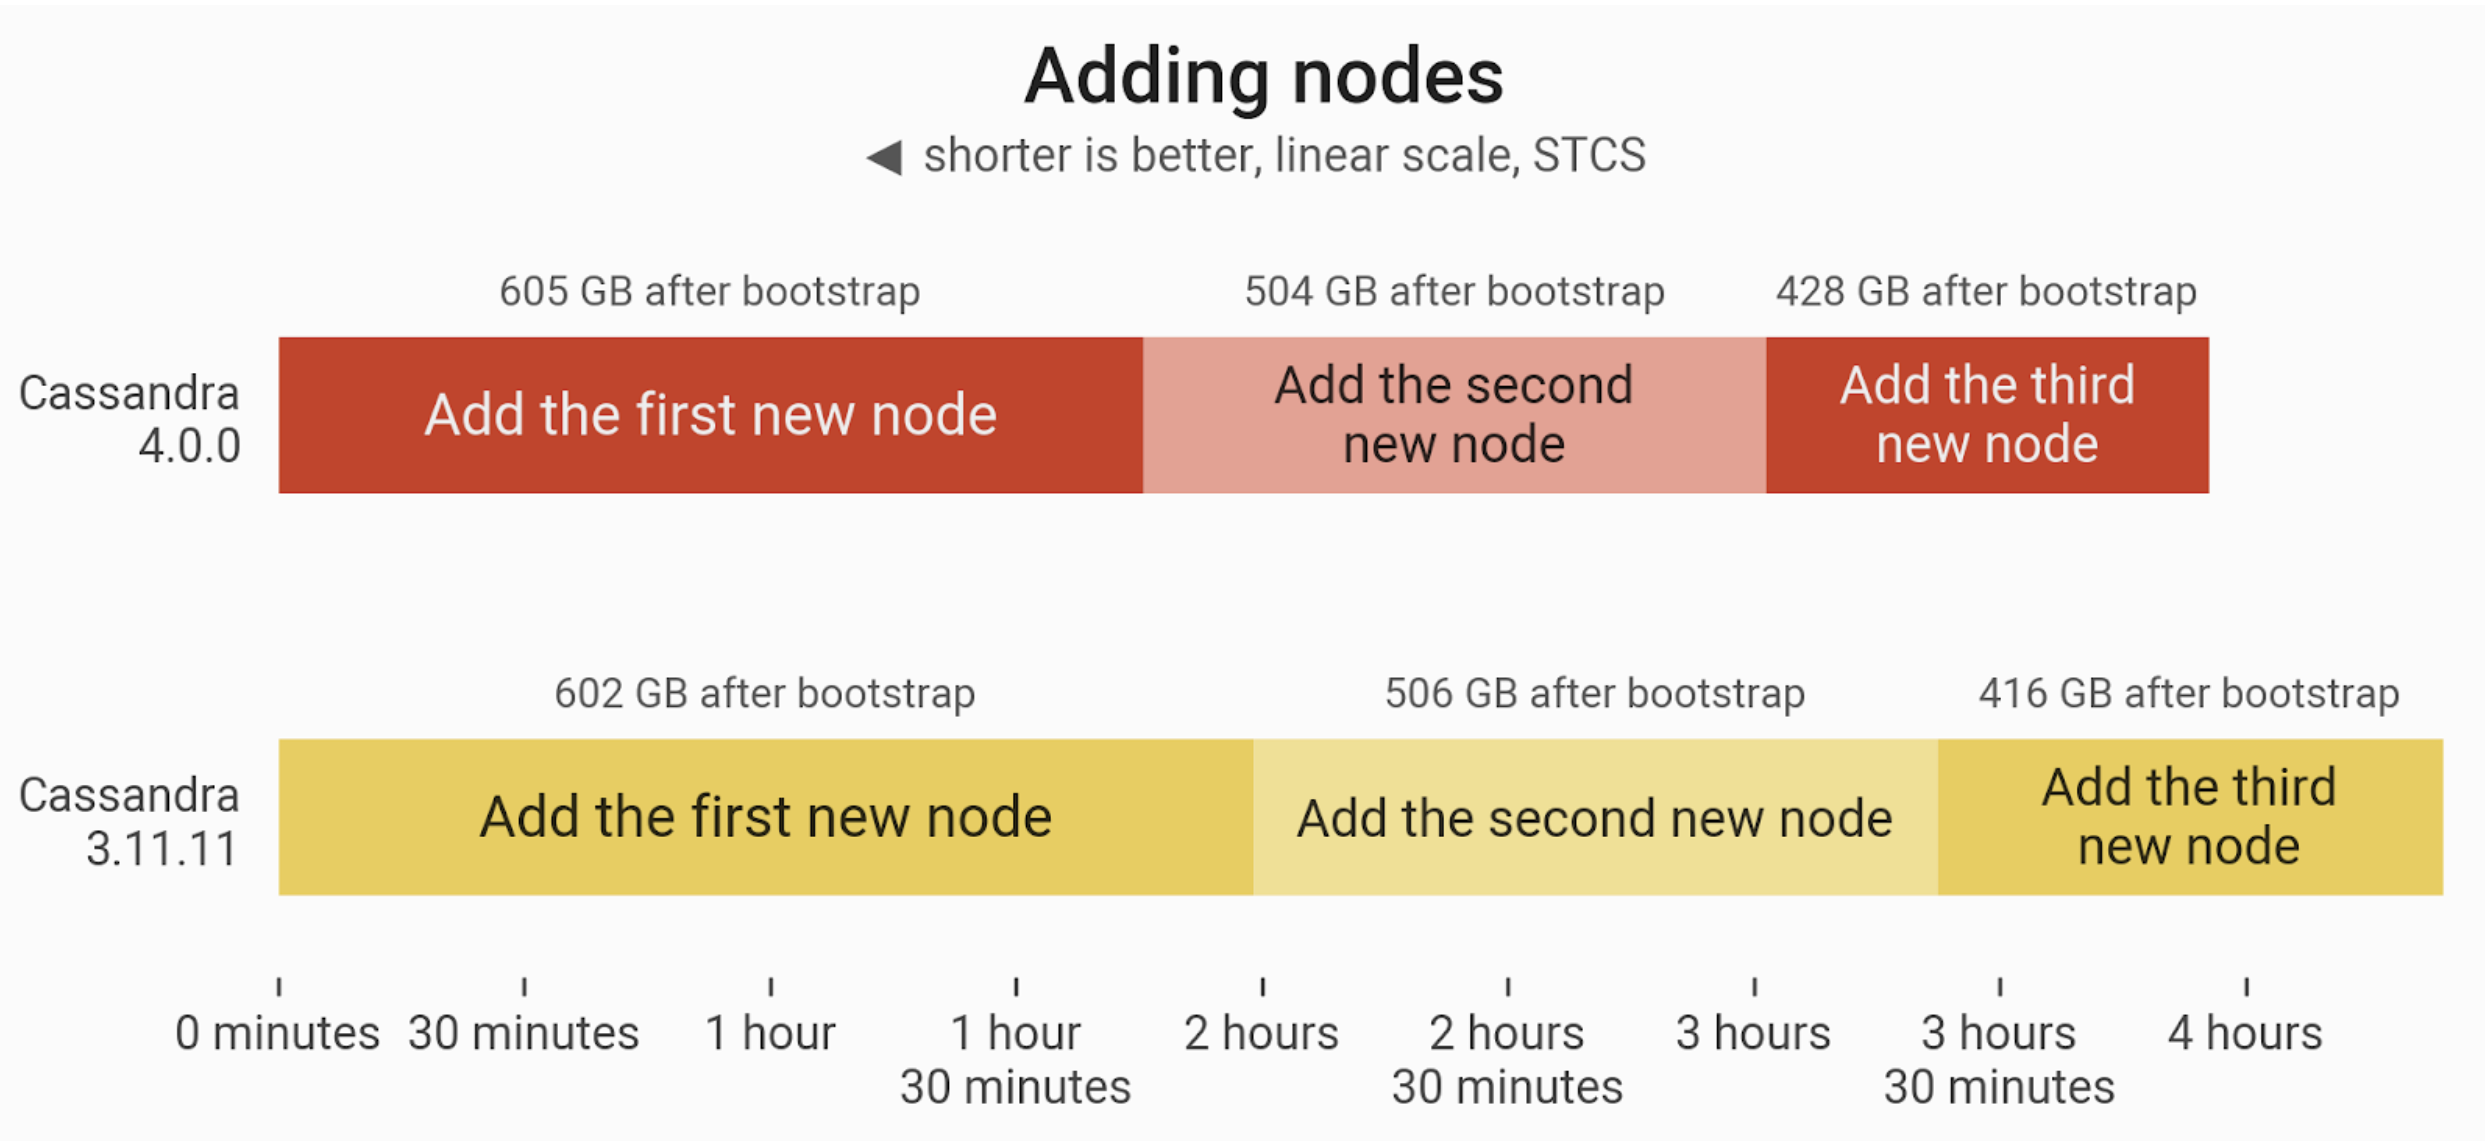
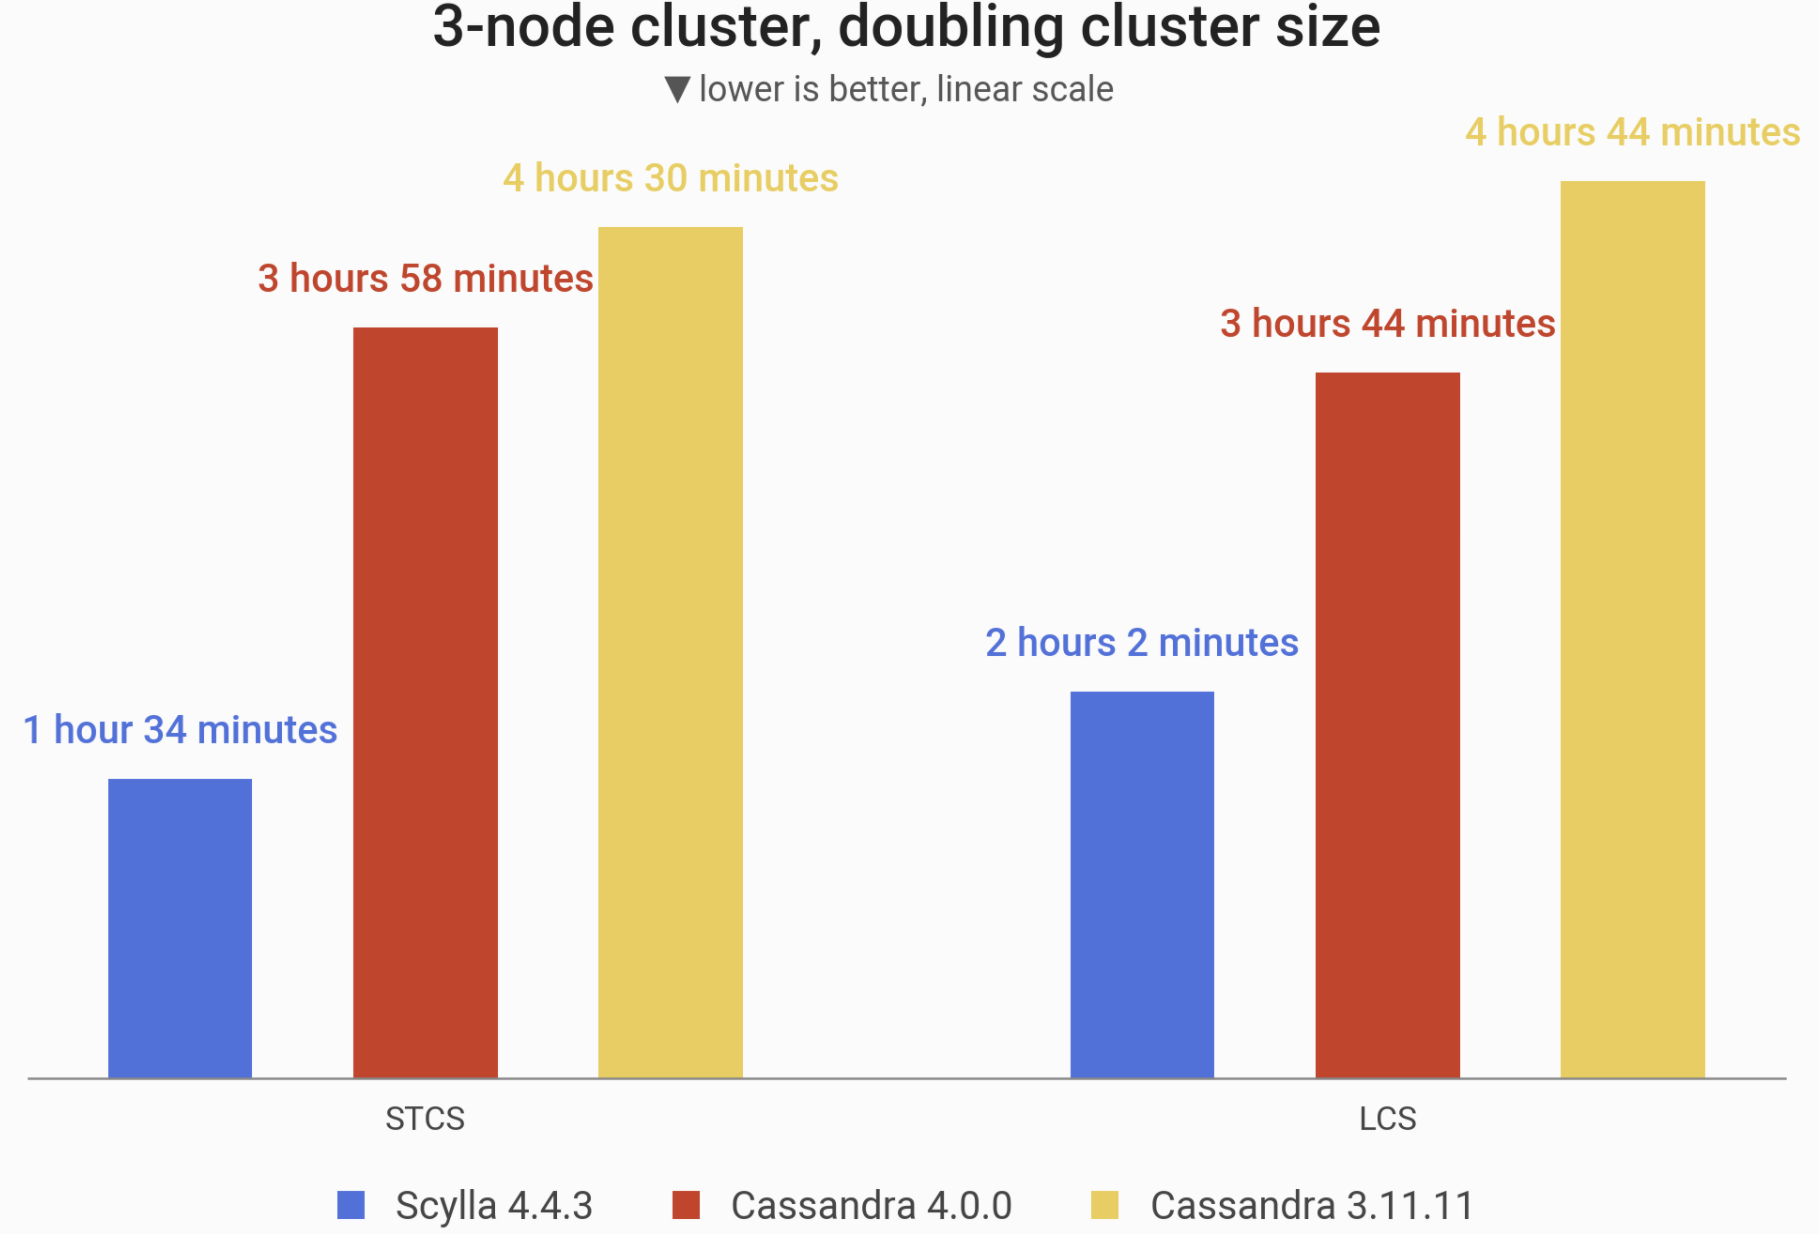
![]()
The time needed to add 3 nodes to an already existing 3-node cluster of i3.4xlarge machines, preloaded with 1 TB of data at RF=3. Cassandra 4.0 performed moderately better than Cassandra 3.11. but Scylla still leads the pack.
| Strategy |
Scylla 4.4.3 |
Cassandra 4.0 |
Cassandra 3.11 |
| STCS |
1 hour 34 minutes 57 seconds |
3 hours 58 minutes 21 seconds |
4 hours 30 minutes 7 seconds |
| LCS |
2 hours 2 minutes 37 seconds |
3 hours 44 minutes 6 seconds |
4 hours 44 minutes 46 seconds |
| Strategy |
Cassandra 4.0 vs Cassandra 3.11 |
Scylla 4.4.3 vs Cassandra 4.0 |
| STCS |
-11% |
-60% |
| LCS |
-21% |
-45% |
Replace node
In this benchmark, we measured how long it took to replace a single node. One of the nodes is brought down and another one is started in its place. Throughout this process the cluster is being agitated by a mixed R/W background load of 25,000 ops at CL=QUORUM.
![]()
The time needed to replace a node in a 3-node cluster of i3.4xlarge machines, preloaded with 1 TB of data at RF=3. Cassandra 4.0 noted an improvements over Cassandra 3.11. but Scylla is still the clear winner, taking around an hour to do what Cassandra 4.0 took over 3 hours to accomplish.
| Strategy |
Scylla 4.4.3 |
Cassandra 4.0 |
Cassandra 3.11 |
| STCS |
54 minutes 19 seconds |
3 hours 28 minutes 46 seconds |
4 hours 35 minutes 56 seconds |
| LCS |
1 hour 9 minutes 18 seconds |
3 hours 19 minutes 17 seconds |
5 hours 4 minutes 9 seconds |
| Strategy |
Cassandra 4.0 vs Cassandra 3.11 |
Scylla 4.4.3 vs Cassandra 4.0 |
| STCS |
-24% |
-73% |
| LCS |
-34% |
-65% |
Major Compaction
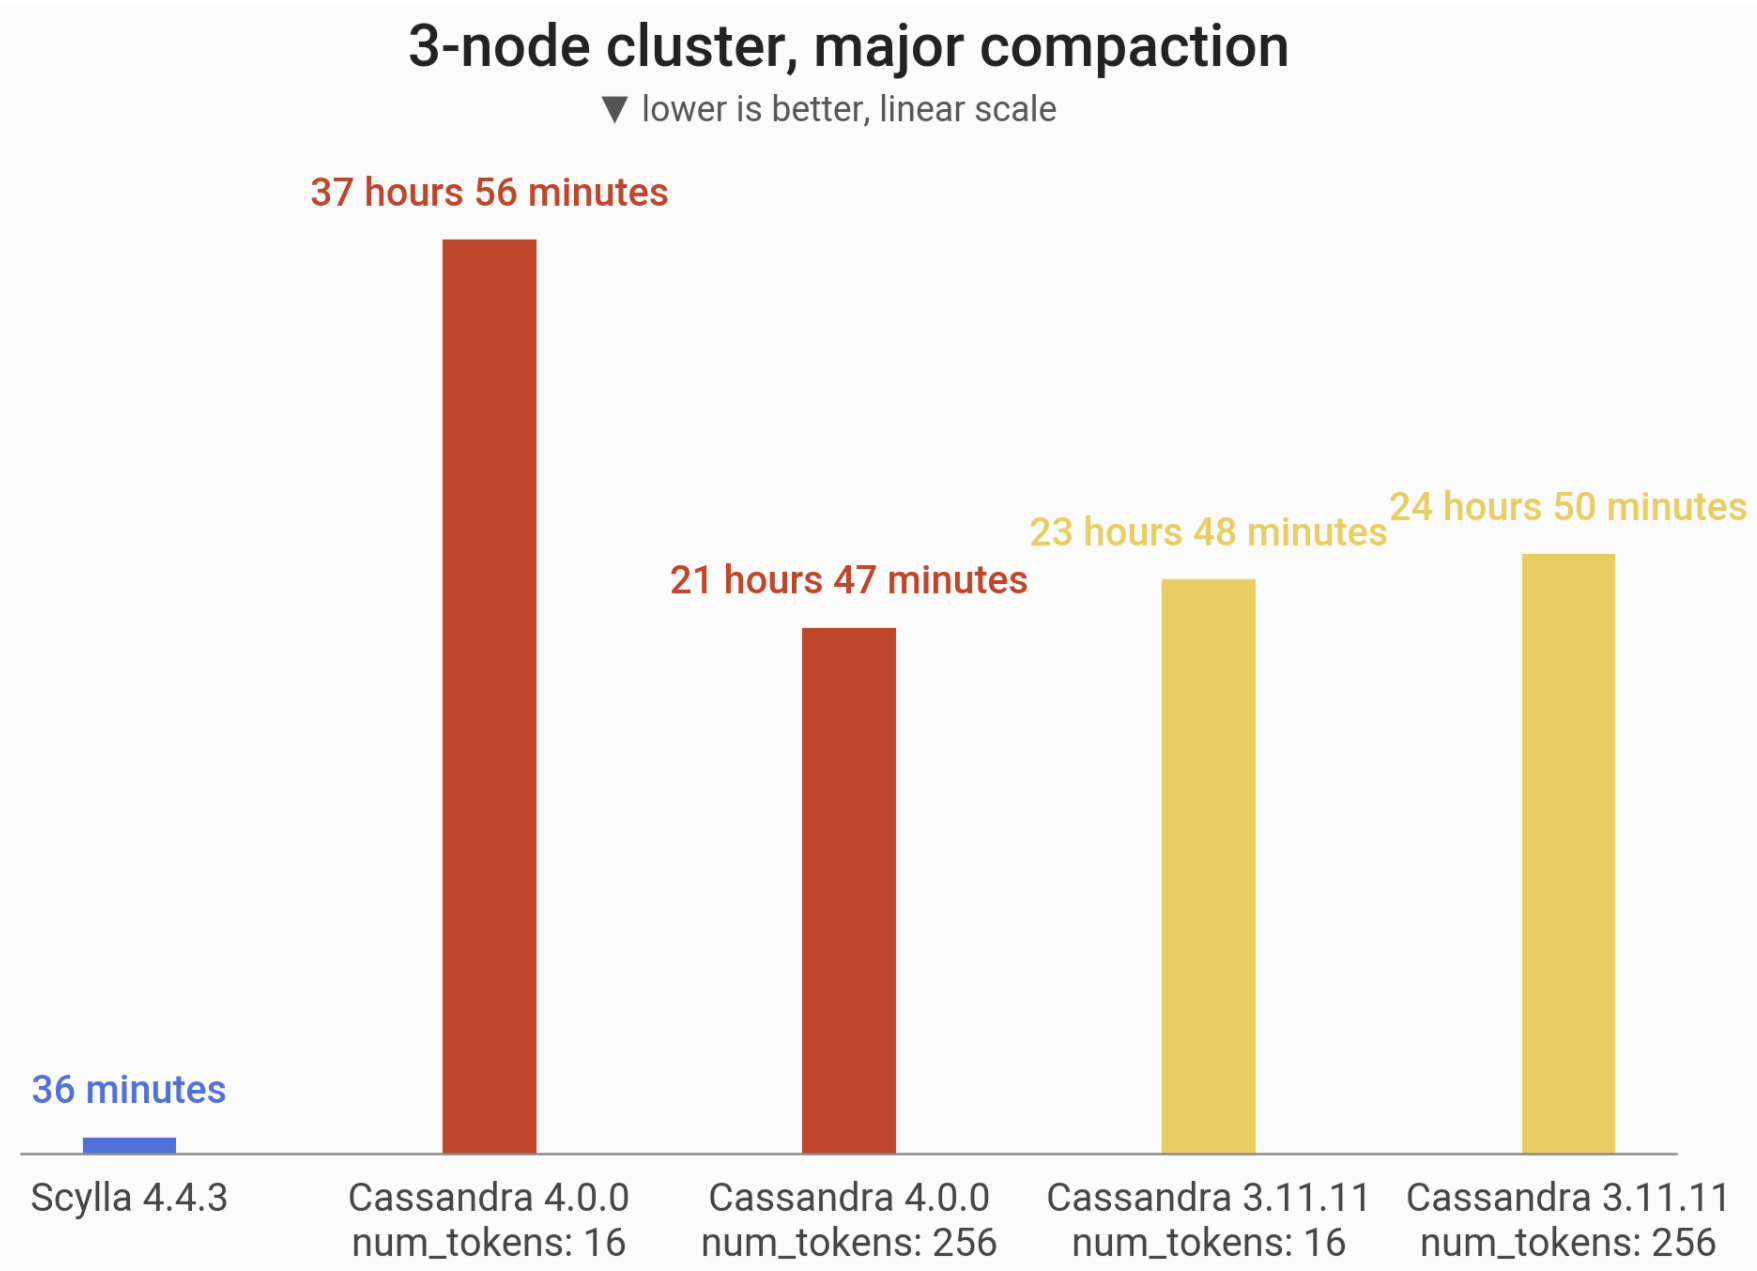
In this benchmark, we measured how long it takes to perform a major compaction on a single node loaded with roughly 1TB of data. Thanks to Scylla’s sharded architecture, it can perform the major compactions on each shard concurrently, while Cassandra is single-thread bound. The result of major compaction is the same in both Scylla and Cassandra: a read is served by a single SSTable. In the later section of this blogpost we also measure the speed of a major compaction in a case where there are many small Cassandra nodes (which get higher parallelism). We observed worse major compaction performance in Cassandra 4.0.0 with the default num_tokens: 16 parameter.
![]()
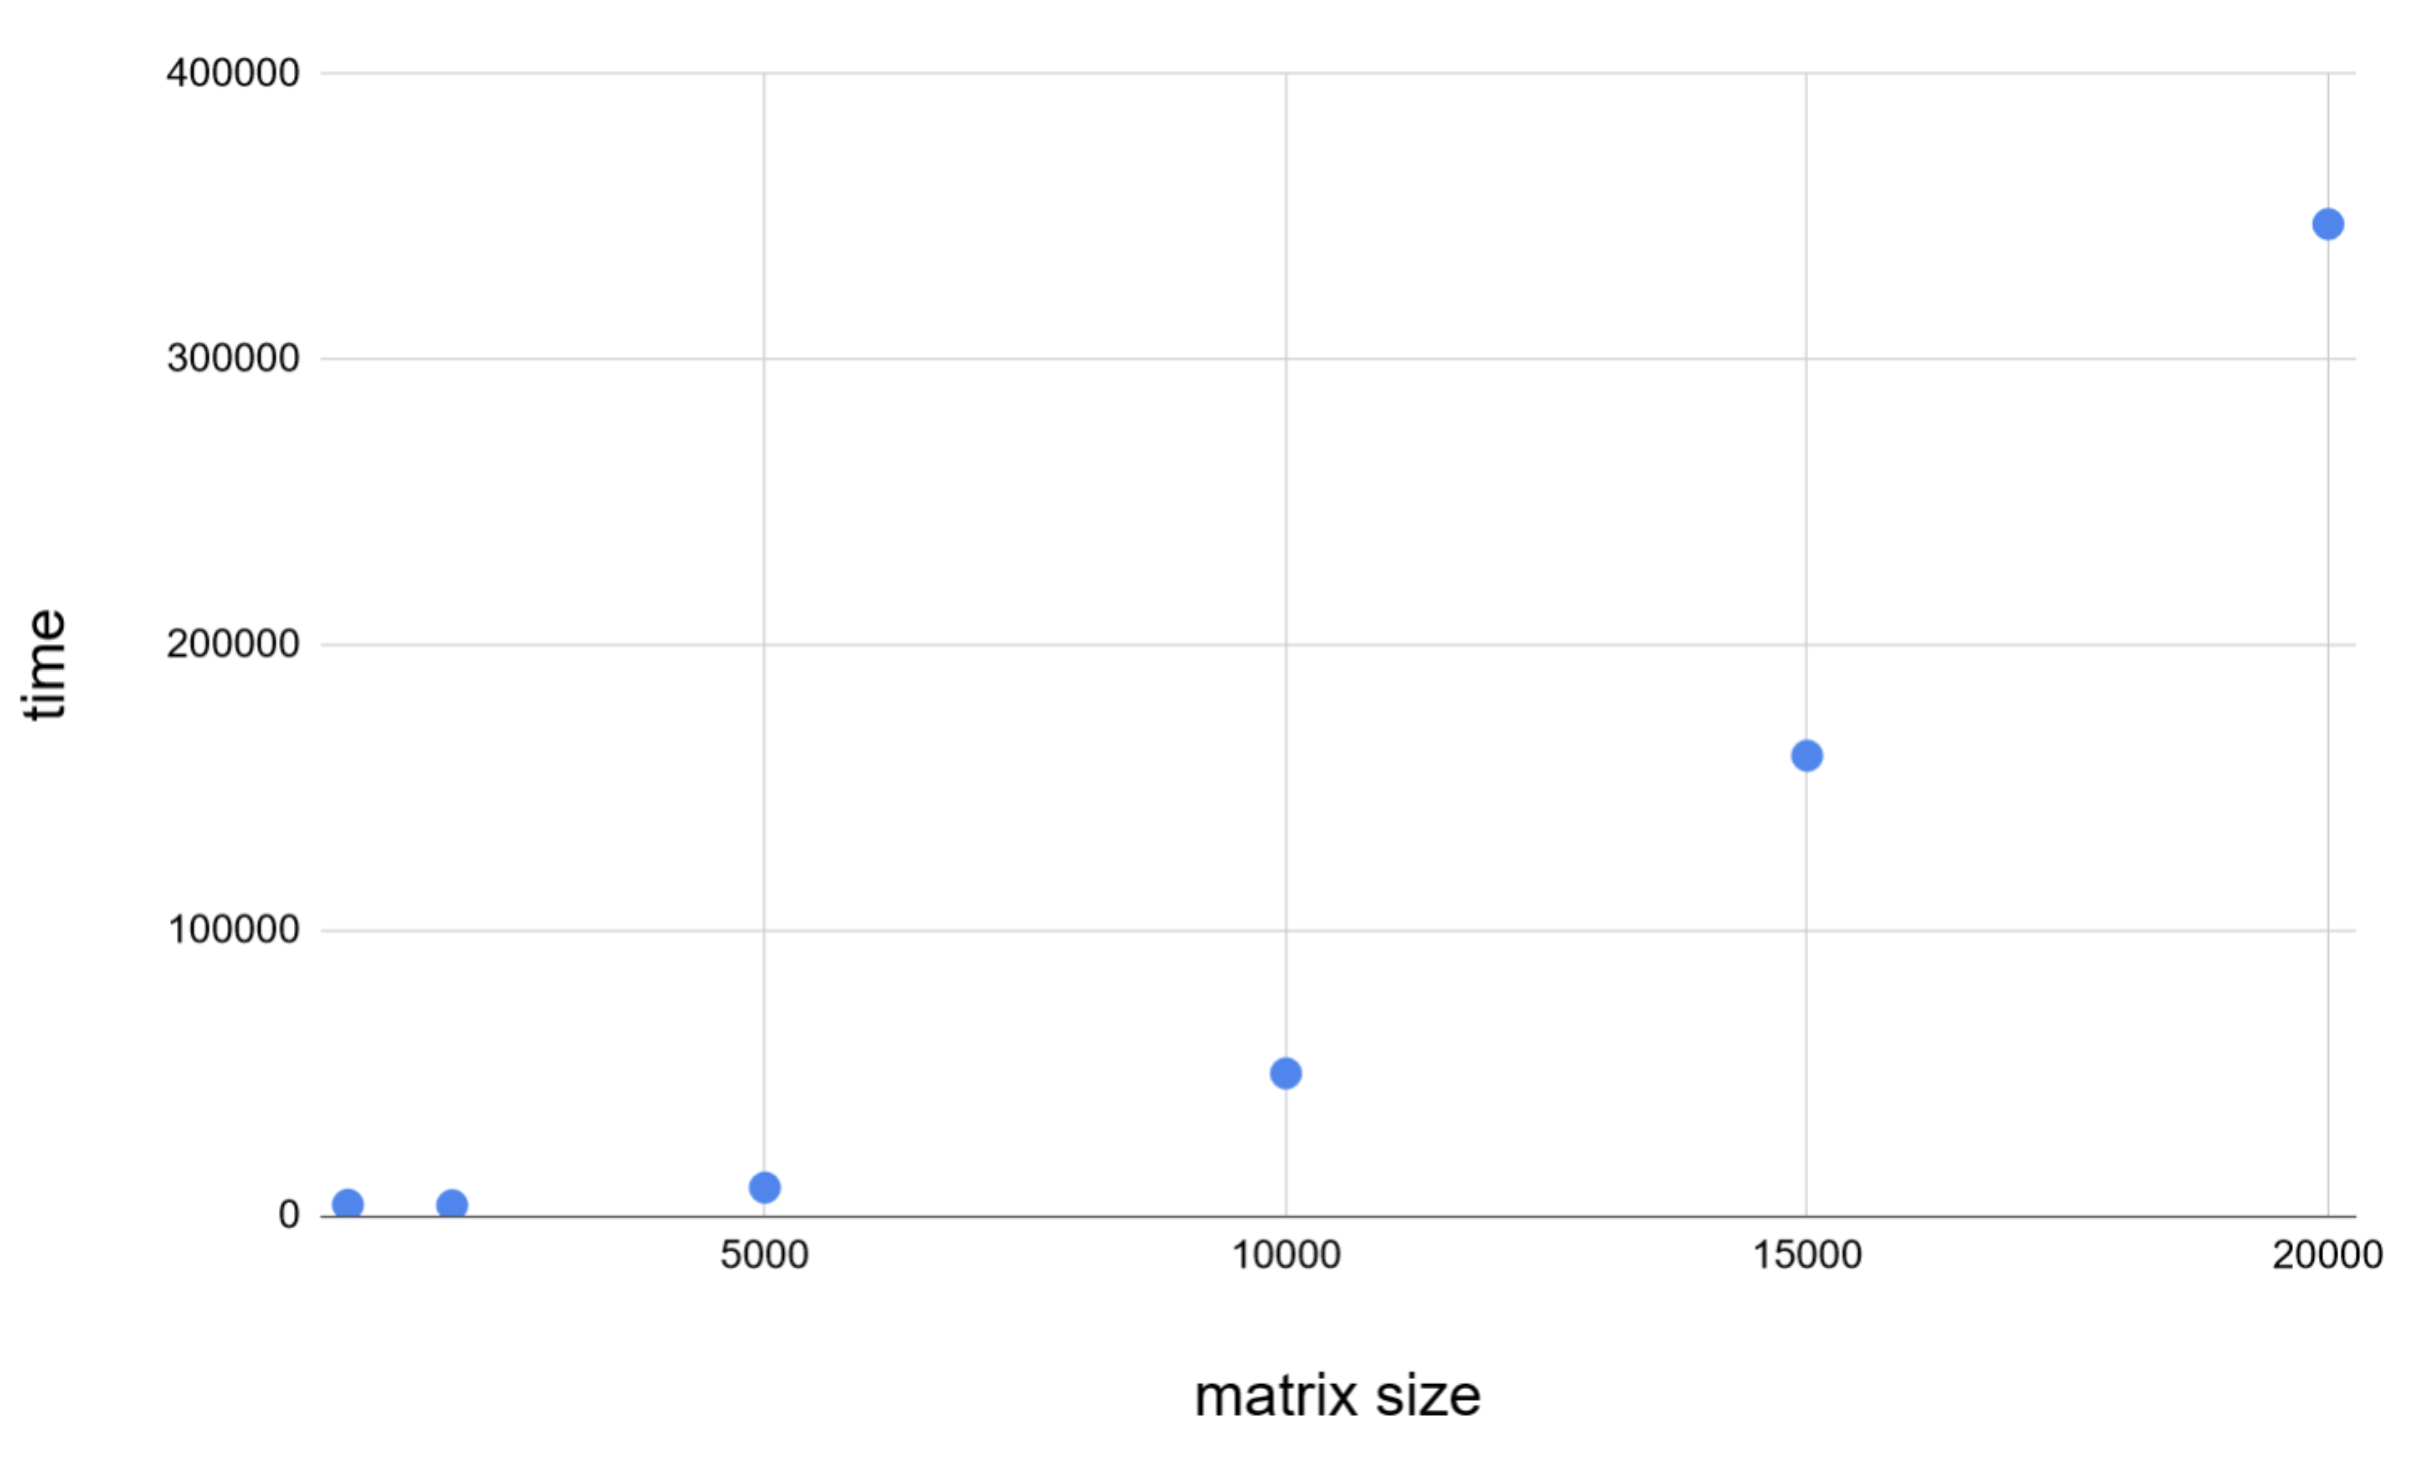
Major compaction of 1 TB of data at RF=1 on i3.4xlarge machine. Scylla demonstrates the power of sharded architecture by compacting on all cores concurrently. In our case Scylla is up to 60x faster and this figure should continue to scale linearly with the number of cores.
|
Scylla 4.4.3 |
Cassandra 4.0 |
Cassandra 3.11 |
Major Compaction (num_tokens: 16) |
num_tokens: 16
not recommended |
21 hours, 47 minutes, 34 seconds
(78,454 seconds) |
24 hours, 50 minutes, 42 seconds
(89,442 seconds) |
Major Compaction (num_tokens: 256) |
36 minutes, 8 seconds (2,168 seconds) |
37 hours, 56 minutes, 32 seconds
(136,592 seconds) |
23 hours, 48 minutes, 56 seconds
(85,736 seconds) |
“4 vs. 40” Benchmark
Now let us compare both databases installed on different hardware, where Scylla gets four powerful 72-core servers, meanwhile Cassandra gets the same i3.4xlarge servers as before, just… forty of them. Why would anyone ever consider such a test? After all, we’re comparing some 4 machines to 40 very different machines. In terms of CPU count, RAM volume or cluster topology these both are like apples and oranges, no?
Not really.
Due to its sharded architecture and custom memory management Scylla can utilize really big hunks of hardware. And by that we mean the-biggest-one-can-get. Meanwhile, Cassandra and its JVM’s garbage collectors excel when they go heavily distributed, with many smaller nodes on the team. So, the true purpose of this test is to show that both CQL solutions can perform similarly in a pretty fair duel, yet Cassandra requires about 2.5x more hardware, for 2.5x the cost. What’s really at stake now is a 10x reduction in the administrative burden: your DBA has either 40 servers to maintain… or just 4. And, as you’ll see, the advantage can go even further than 10x.
4 vs. 40 Node Setup
We set up clusters on Amazon EC2 in a single Availability Zone within us-east-2 datacenter, but this time the Scylla cluster consists of 4 i3.metal VMs. The competing Cassandra cluster consisted of 40 i3.4xlarge VMs. Servers are initialized with clean machine images (AMIs) of Ubuntu 20.04 (Cassandra 4.0) or CentOS 7.9 (Scylla 4.4).
Apart from the cluster, fifteen loader machines were used to run cassandra-stress to insert data, and — later — to provide background load at CL=QUORUM to mess with the administrative operations.
|
Scylla |
Cassandra |
Loaders |
| EC2 Instance type |
i3.metal |
i3.4xlarge |
c5n.9xlarge |
| Cluster size |
4 |
40 |
15 |
| Storage (total) |
8x 1.9 TB NVMe in RAID0
(60.8 TB) |
2x 1.9 TB NVMe in RAID0
(152 TB) |
Not important for a loader (EBS-only) |
| Network |
25 Gbps |
Up to 10 Gbps |
50 Gbps |
| vCPUs (total) |
72 (288) |
16 (640) |
36 (540) |
| RAM (total) |
512 (2048) GiB |
122 (4880) GiB |
96 (1440) GiB |
Once up and running, both databases were loaded with random data at RF=3 until the cluster’s total disk usage reached approximately 40 TB. This translated to 1 TB of data per Cassandra node and 10 TB of data per Scylla node. After loading was done, we flushed the data and waited until the compactions finished, so we can start the actual benchmarking.
![]()
A Scylla cluster can be 10x smaller in node count and run on a cluster 2.5x cheaper, yet maintain the equivalent performance of Cassandra 4.
Throughput and Latencies
Mixed Workload – 50% reads and 50% writes
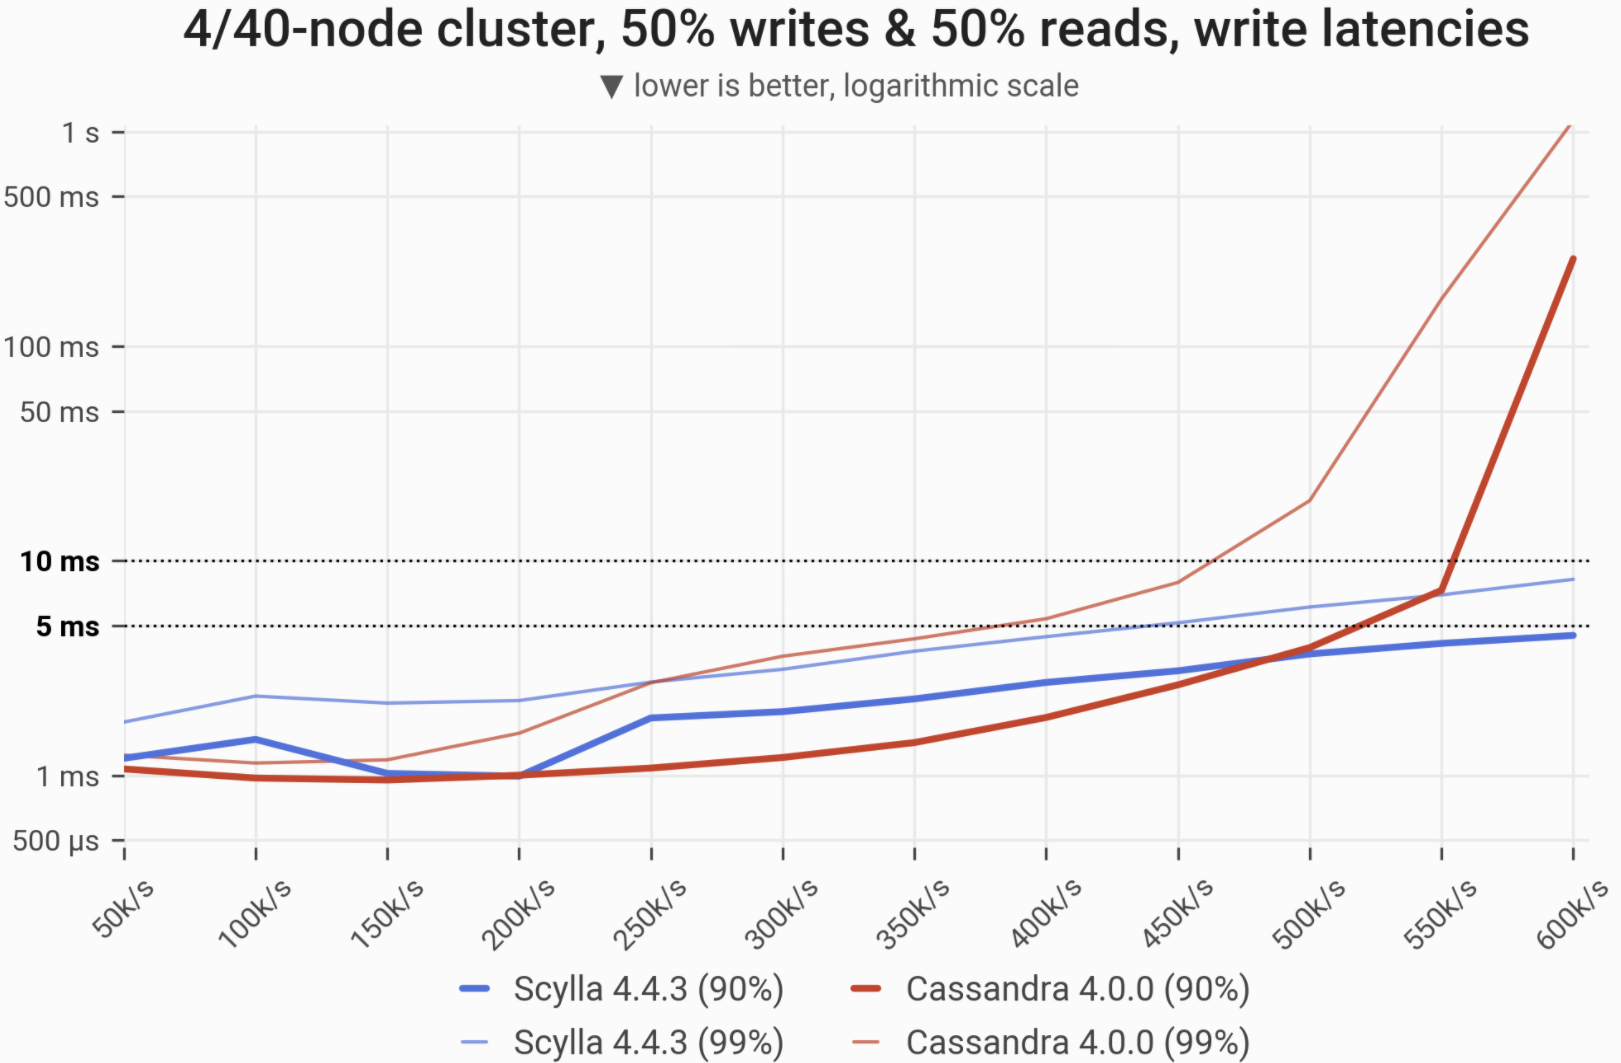
![]()
The 90- and 99-percentile latencies of UPDATE queries, as measured on:
- 4-node Scylla cluster (4 x i3.metal, 288 vCPUs in total)
- 40-node Cassandra cluster (40 x i3.4xlarge, 640 vCPUs in total).
Workload is uniformly distributed, i.e. every partition in the multi-TB dataset has an equal chance of being selected/updated. Under low load Cassandra slightly outperforms Scylla.The reason is that Scylla runs more compaction automatically when it is idle and the default scheduler tick of 0.5 ms hurts the P99 latency. There is a parameter that controls it but we wanted to provide out-of-the-box results with zero custom tuning or configuration.
| Metric |
Scylla 4.4.3 |
Cassandra 4.0 |
Scylla 4.4.3 vs. Cassandra 4.0 |
| Maximum throughput |
600k/s |
600k/s |
1x |
| Maximum throughput with 99% latency <10ms |
600k/s |
450k/s |
1.33x |
![]()
The 90- and 99-percentile latencies of SELECT queries, as measured on:
- 4-node Scylla cluster (4 x i3.metal, 288 vCPUs in total)
- 40-node Cassandra cluster (40 x i3.4xlarge, 640 vCPUs in total).
Workload is uniformly distributed, i.e. every partition in the multi-TB dataset has an equal chance of being selected/updated. Under low load Cassandra slightly outperforms Scylla.
| Metric |
Scylla 4.4.3 |
Cassandra 4.0 |
Scylla 4.4.3 vs. Cassandra 4.0 |
| Maximum throughput |
600k/s |
600k/s |
1x |
| Maximum throughput with 99% latency <10ms |
500k/s |
350k/s |
1.42x |
Scaling the cluster up by 25%
In this benchmark, we increase the capacity of the cluster by 25%:
- By adding a single Scylla node to the cluster (from 4 nodes to 5)
- By adding 10 Cassandra nodes to the cluster (from 40 nodes to 50 nodes)
![]()
|
Scylla 4.4.3 |
Cassandra 4.0 |
Scylla 4.4 vs. Cassandra 4.0 |
| Add 25% capacity |
1 hour, 29 minutes |
16 hours, 54 minutes |
11x faster |
Major Compaction
In this benchmark we measure the throughput of a major compaction. To compensate for Cassandra having 10 times more nodes (each having 1/10th of the data), this benchmark measures throughput of a single Scylla node performing major compaction and the collective throughput of 10 Cassandra nodes performing major compactions concurrently.
![]()
Throughput of a major compaction at RF=1 (more is better). Scylla runs on a single i3.metal machine (72 vCPUs) and competes with a 10-node cluster of Cassandra 4 (10x i3.4xlarge machines; 160 vCPUs in total). Scylla can split this problem across CPU cores, which Cassandra cannot do, so – effectively – Scylla performs 32x better in this case.
|
Scylla 4.4.3 |
Cassandra 4.0 |
Scylla 4.4 vs. Cassandra 4.0 |
| Major Compaction |
1,868 MB/s |
56 MB/s |
32x faster |
Summary
On identical hardware, Scylla Open Source 4.4.3 withstood up to 5x greater traffic and in almost every tested scenario offered lower latencies than Cassandra 4.0.
We also demonstrated a specific use-case where choosing Scylla over Cassandra 4 would result in $170,000 annual savings in the hardware costs alone, not to mention the ease of administration or environmental impact.
Nonetheless, Cassandra 4 is undeniably far better than Cassandra 3.11. It improved query latencies in almost all tested scenarios and sped up all the processes that involve streaming. Even if you choose not to take advantage of Scylla for its superior performance, upgrading from Cassandra 3.11 to Cassandra 4.0 is a wise idea.
Yet if you are determined to take the effort of an upgrade, then why not aim higher and get even more performance? Or at least keep the same performance and pocket the difference via savings?
While the benchmarks speak for themselves, we also hope that you don’t just take our word for Scylla’s superior performance. That’s why we provided everything that’s needed to re-run them yourself.
Beyond performance benchmarks, there are even more reasons to run Scylla: the feature set is bigger. For example, our CDC implementation is easier to manage and consume, implemented as standard CQL-readable tables. Also, Scylla’s Lightweight Transactions (LWT) are more efficient than Cassandra’s. Scylla provides observability through Scylla Monitoring Stack to watch over your clusters using Grafana and Prometheus. All of that you get with Scylla Open Source. With Scylla Enterprise on top of it, you also get unique features like our Incremental Compaction Strategy (ICS) for additional storage efficiency, workload prioritization and more.
Whether you’re a CTO, systems architect, lead engineer, SRE or DBA — your time to consider Scylla is right now and your organization is unlikely to regret it.
Supplementary Information
Here you can check out detailed results of latency/throughput benchmarks, JVM settings and cassandra.yaml from Cassandra 3 and Cassandra 4, as well as cassandra-stress invocations used to run benchmarks. Scylla used default configuration.
Cassandra 3.11 configuration
| JVM settings |
JVM version: OpenJDK 8
-Xms48G

-Xmx48G

-XX:+UseG1GC

-XX:G1RSetUpdatingPauseTimePercent=5

-XX:MaxGCPauseMillis=500

-XX:InitiatingHeapOccupancyPercent=70

-XX:ParallelGCThreads=16 |
| cassandra.yaml |
Only settings changed from the default configuration are mentioned here.
disk_access_mode: mmap_index_only

row_cache_size_in_mb: 10240

concurrent_writes: 128

file_cache_size_in_mb: 2048

buffer_pool_use_heap_if_exhausted: true

disk_optimization_strategy: ssd

memtable_flush_writers: 4

trickle_fsync: true

concurrent_compactors: 16

compaction_throughput_mb_per_sec: 960

stream_throughput_outbound_megabits_per_sec: 7000
|
Cassandra 4.0 configuration
| JVM settings |
JVM version: OpenJDK 16
-Xmx70G

-Xmx70G

-XX:ConcGCThreads=16

-XX:+UseZGC
-XX:ConcGCThreads=16

-XX:ParallelGCThreads=16

-XX:+UseTransparentHugePages

-verbose:gc

-Djdk.attach.allowAttachSelf=true

-Dio.netty.tryReflectionSetAccessible=true
|
| cassandra.yaml |
Only settings changed from the default configuration are mentioned here.
disk_access_mode: mmap_index_only

row_cache_size_in_mb: 10240

concurrent_writes: 128

file_cache_size_in_mb: 2048

buffer_pool_use_heap_if_exhausted: true

disk_optimization_strategy: ssd

memtable_flush_writers: 4

trickle_fsync: true

concurrent_compactors: 16

compaction_throughput_mb_per_sec: 960

stream_throughput_outbound_megabits_per_sec: 7000
In major compaction benchmarks, the parameter compaction_throughput_mb_per_sec was set to 0 to make sure the compaction was not throttled. |
Cassandra-stress parameters
Only the important facts and options are mentioned below.
- Scylla’s Shard-aware Java driver was used.
- Background loads were executed in the loop (so
duration=5m is not a problem).
REPLICATION_FACTOR is 3 (except for major compaction benchmark).COMPACTION_STRATEGY is SizeTieredCompactionStrategy unless stated otherwise.loadgenerator_count is the number of generator machines (3 for “3 vs 3” benchmarks, 15 for “4 vs 40”).BACKGROUND_LOAD_OPS is 1000 in major compaction, 25000 in other benchmarks.DURATION_MINUTES is 10 for in-memory benchmarks, 30 for other benchmarks.
| Inserting data |
write cl=QUORUM
-schema "replication(strategy=SimpleStrategy,replication_factor={REPLICATION_FACTOR})" "compaction(strategy={COMPACTION_STRATEGY})"
-mode native cql3
threads and throttle parameters were chosen for each DB separately, to ensure 3TB were inserted quickly, yet also to provide headroom for minor compactions and avoid timeouts/large latencies.In case of “4 vs 40” benchmarks additional parameter maxPending=1024 was used.
|
| Background load for replace node |
mixed ratio(write=1,read=1)
duration=5m
cl=QUORUM
-pop dist=UNIFORM(1..{ROW_COUNT})
-mode native cql3
-rate "threads=700 throttle={BACKGROUND_LOAD_OPS // loadgenerator_count}/s" |
| Background load for new nodes / major compaction |
mixed ratio(write=1,read=1)
duration=5m
cl=QUORUM
-pop dist=UNIFORM(1..{ROW_COUNT})
-mode native cql3
-rate "threads=700 fixed={BACKGROUND_LOAD_OPS // loadgenerator_count}/s" |
| Cache warmup in Gaussian latency / throughput |
mixed ratio(write=0,read=1)
duration=180m
cl=QUORUM -pop dist=GAUSSIAN(1..{ROW_COUNT},{GAUSS_CENTER},{GAUSS_SIGMA})
-mode native cql3

-rate "threads=500 throttle=35000/s"

-node {cluster_string}') |
| Latency / throughput – Gaussian |
duration={DURATION_MINUTES}m
cl=QUORUM
-pop dist=GAUSSIAN(1..{ROW_COUNT},{GAUSS_CENTER},{GAUSS_SIGMA})
-mode native cql3
"threads=500 fixed={rate // loadgenerator_count}/s" |
| Latency / throughput – uniform / in-memory |
duration={DURATION_MINUTES}m
cl=QUORUM
-pop dist=UNIFORM(1..{ROW_COUNT})
-mode native cql3
-rate "threads=500 fixed={rate // loadgenerator_count}/s"
In case of “4 vs 40” benchmarks additional parameter maxPending=1024 was used. |
The post Apache Cassandra 4.0 vs. Scylla 4.4: Comparing Performance appeared first on ScyllaDB.


 The upcoming


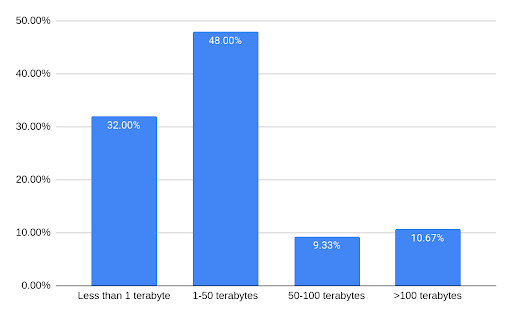 How much data do you have under management in your transactional database systems?


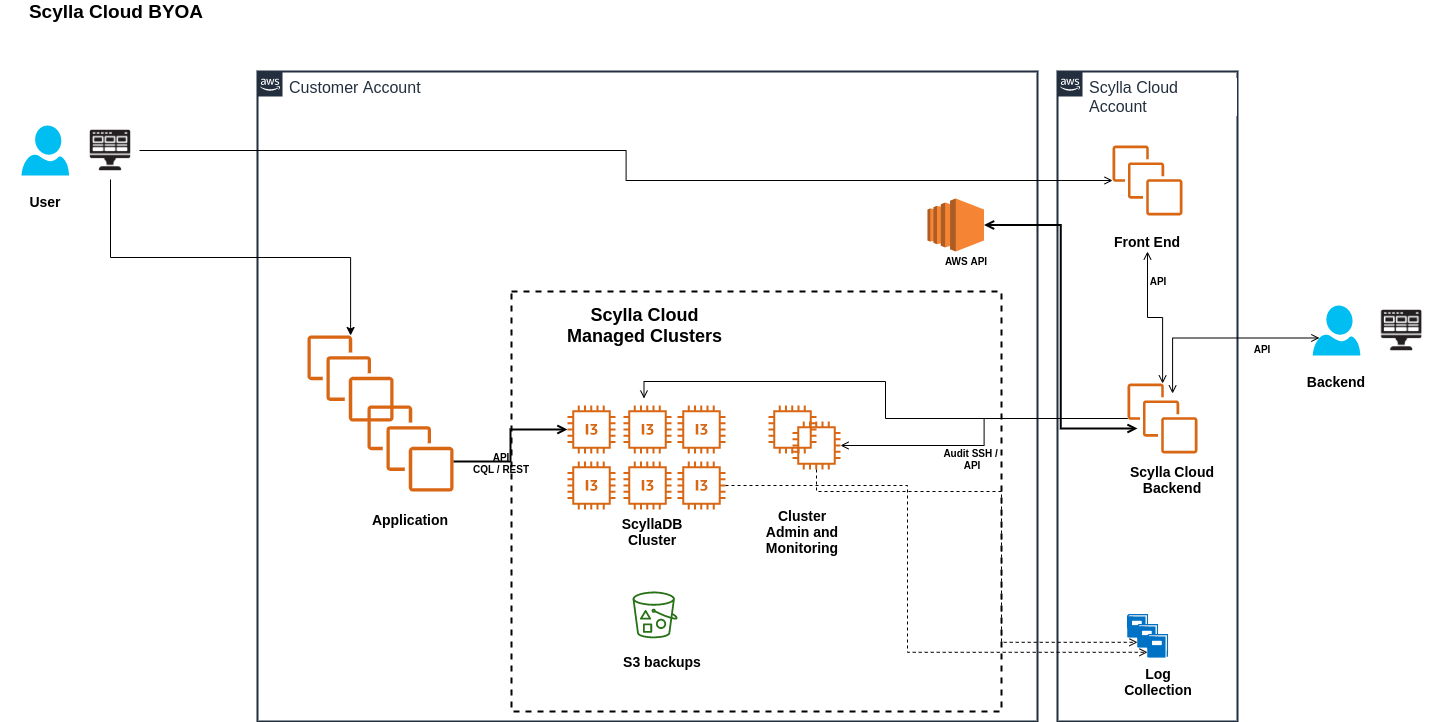
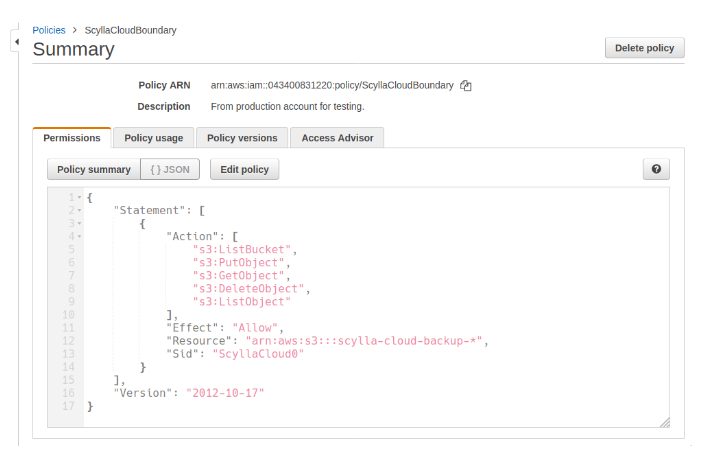
 Upon selection of your account as a destination for Scylla Cloud deployment, Scylla Cloud provides a wizard that will walk you through all the steps to create a cloud policy and an IAM role for Scylla Cloud. See our